Xylanibacterium ulmi
Taxonomy: cellular organisms; Bacteria; Terrabacteria group; Actinobacteria; Actinomycetia; Micrococcales; Promicromonosporaceae; Xylanibacterium
Average proteome isoelectric point is 6.32
Get precalculated fractions of proteins

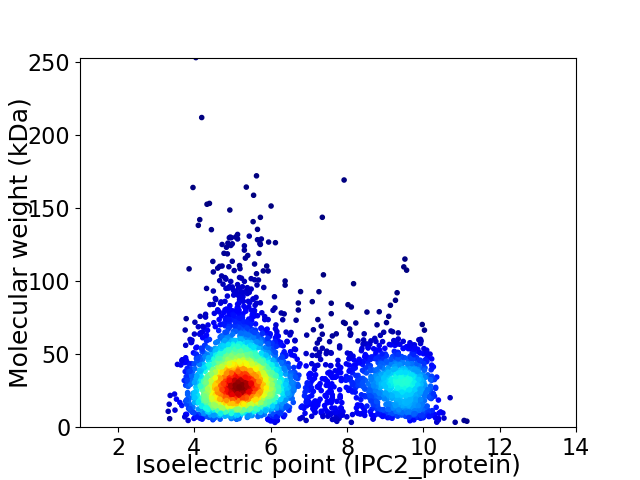
Virtual 2D-PAGE plot for 3500 proteins (isoelectric point calculated using IPC2_protein)
Get csv file with sequences according to given criteria:
* You can choose from 21 different methods for calculating isoelectric point
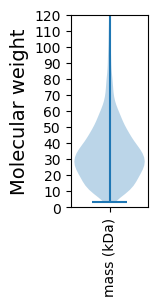
Summary statistics related to proteome-wise predictions


Protein with the lowest isoelectric point:
>tr|A0A4Q7M6R4|A0A4Q7M6R4_9MICO Uncharacterized protein OS=Xylanibacterium ulmi OX=228973 GN=EV386_2664 PE=4 SV=1
MM1 pKa = 7.31KK2 pKa = 10.12MSMTKK7 pKa = 10.14RR8 pKa = 11.84AARR11 pKa = 11.84VAALATAGALALAACTPGGDD31 pKa = 4.1AADD34 pKa = 5.06DD35 pKa = 4.21GAATDD40 pKa = 3.7AATDD44 pKa = 3.55GGGAEE49 pKa = 4.17GTVTVWHH56 pKa = 6.32YY57 pKa = 10.99FSDD60 pKa = 4.15PQQVALMDD68 pKa = 4.28KK69 pKa = 10.12YY70 pKa = 11.59AEE72 pKa = 4.24LAEE75 pKa = 4.21AANPGMTVDD84 pKa = 4.16NVFVPYY90 pKa = 10.78DD91 pKa = 3.39QMNSQLISAAGAGQGPDD108 pKa = 3.14VVIFNGAEE116 pKa = 3.79TSTIALAGALAPLDD130 pKa = 4.49DD131 pKa = 4.23LWGTFADD138 pKa = 4.16ADD140 pKa = 3.86QFPDD144 pKa = 3.92SVIHH148 pKa = 5.75TVDD151 pKa = 2.76GTMYY155 pKa = 10.9AVQGYY160 pKa = 10.33VNLLGLWYY168 pKa = 10.51NQDD171 pKa = 3.18ILDD174 pKa = 4.82EE175 pKa = 5.24IGVQPPTTIDD185 pKa = 3.49EE186 pKa = 4.85LEE188 pKa = 4.2SAMAAAVAAGHH199 pKa = 6.47GGITLSGLPNSQGEE213 pKa = 4.36WQGFPWLSAEE223 pKa = 3.91GFTYY227 pKa = 10.25EE228 pKa = 4.53NPSAQALEE236 pKa = 4.41AGLTRR241 pKa = 11.84VSNWVEE247 pKa = 4.16QGWLPQEE254 pKa = 4.1AVNWDD259 pKa = 3.29QTVPFQQFAAGGFAFAANGNWQQGTAEE286 pKa = 4.25ADD288 pKa = 2.97ADD290 pKa = 3.72FTYY293 pKa = 10.39GVVPLPLGDD302 pKa = 3.72SGQVYY307 pKa = 10.6LGGEE311 pKa = 4.2GAGIGANSANPEE323 pKa = 4.21LAWAYY328 pKa = 7.53LTSSYY333 pKa = 11.28LSFEE337 pKa = 4.59GNLAAADD344 pKa = 4.01LVGSLPARR352 pKa = 11.84ADD354 pKa = 3.39AGQHH358 pKa = 6.63DD359 pKa = 5.19SVTSNEE365 pKa = 3.9LLKK368 pKa = 10.87PFAEE372 pKa = 4.85TITMFGAQYY381 pKa = 10.09PSAAIPAEE389 pKa = 3.93AVADD393 pKa = 3.71VQLRR397 pKa = 11.84MGQAWSAVIGRR408 pKa = 11.84QHH410 pKa = 6.38SPADD414 pKa = 3.6AAHH417 pKa = 6.23TAMTALEE424 pKa = 4.26GLLGG428 pKa = 3.85
MM1 pKa = 7.31KK2 pKa = 10.12MSMTKK7 pKa = 10.14RR8 pKa = 11.84AARR11 pKa = 11.84VAALATAGALALAACTPGGDD31 pKa = 4.1AADD34 pKa = 5.06DD35 pKa = 4.21GAATDD40 pKa = 3.7AATDD44 pKa = 3.55GGGAEE49 pKa = 4.17GTVTVWHH56 pKa = 6.32YY57 pKa = 10.99FSDD60 pKa = 4.15PQQVALMDD68 pKa = 4.28KK69 pKa = 10.12YY70 pKa = 11.59AEE72 pKa = 4.24LAEE75 pKa = 4.21AANPGMTVDD84 pKa = 4.16NVFVPYY90 pKa = 10.78DD91 pKa = 3.39QMNSQLISAAGAGQGPDD108 pKa = 3.14VVIFNGAEE116 pKa = 3.79TSTIALAGALAPLDD130 pKa = 4.49DD131 pKa = 4.23LWGTFADD138 pKa = 4.16ADD140 pKa = 3.86QFPDD144 pKa = 3.92SVIHH148 pKa = 5.75TVDD151 pKa = 2.76GTMYY155 pKa = 10.9AVQGYY160 pKa = 10.33VNLLGLWYY168 pKa = 10.51NQDD171 pKa = 3.18ILDD174 pKa = 4.82EE175 pKa = 5.24IGVQPPTTIDD185 pKa = 3.49EE186 pKa = 4.85LEE188 pKa = 4.2SAMAAAVAAGHH199 pKa = 6.47GGITLSGLPNSQGEE213 pKa = 4.36WQGFPWLSAEE223 pKa = 3.91GFTYY227 pKa = 10.25EE228 pKa = 4.53NPSAQALEE236 pKa = 4.41AGLTRR241 pKa = 11.84VSNWVEE247 pKa = 4.16QGWLPQEE254 pKa = 4.1AVNWDD259 pKa = 3.29QTVPFQQFAAGGFAFAANGNWQQGTAEE286 pKa = 4.25ADD288 pKa = 2.97ADD290 pKa = 3.72FTYY293 pKa = 10.39GVVPLPLGDD302 pKa = 3.72SGQVYY307 pKa = 10.6LGGEE311 pKa = 4.2GAGIGANSANPEE323 pKa = 4.21LAWAYY328 pKa = 7.53LTSSYY333 pKa = 11.28LSFEE337 pKa = 4.59GNLAAADD344 pKa = 4.01LVGSLPARR352 pKa = 11.84ADD354 pKa = 3.39AGQHH358 pKa = 6.63DD359 pKa = 5.19SVTSNEE365 pKa = 3.9LLKK368 pKa = 10.87PFAEE372 pKa = 4.85TITMFGAQYY381 pKa = 10.09PSAAIPAEE389 pKa = 3.93AVADD393 pKa = 3.71VQLRR397 pKa = 11.84MGQAWSAVIGRR408 pKa = 11.84QHH410 pKa = 6.38SPADD414 pKa = 3.6AAHH417 pKa = 6.23TAMTALEE424 pKa = 4.26GLLGG428 pKa = 3.85
Molecular weight: 44.2 kDa
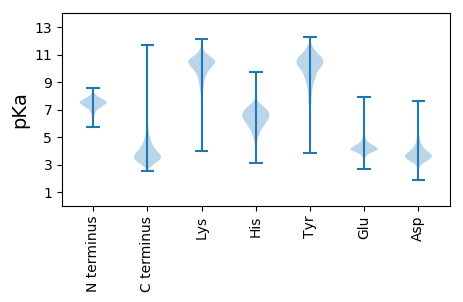
Isoelectric point according different methods:
Protein with the highest isoelectric point:
>tr|A0A4Q7M511|A0A4Q7M511_9MICO Phospholipase D-like protein OS=Xylanibacterium ulmi OX=228973 GN=EV386_3404 PE=4 SV=1
MM1 pKa = 7.4GSVIKK6 pKa = 10.42KK7 pKa = 8.47RR8 pKa = 11.84RR9 pKa = 11.84KK10 pKa = 9.22RR11 pKa = 11.84MAKK14 pKa = 9.41KK15 pKa = 9.87KK16 pKa = 9.7HH17 pKa = 5.84RR18 pKa = 11.84KK19 pKa = 8.56LLRR22 pKa = 11.84KK23 pKa = 7.78TRR25 pKa = 11.84HH26 pKa = 3.65QRR28 pKa = 11.84RR29 pKa = 11.84NKK31 pKa = 9.78KK32 pKa = 9.85
MM1 pKa = 7.4GSVIKK6 pKa = 10.42KK7 pKa = 8.47RR8 pKa = 11.84RR9 pKa = 11.84KK10 pKa = 9.22RR11 pKa = 11.84MAKK14 pKa = 9.41KK15 pKa = 9.87KK16 pKa = 9.7HH17 pKa = 5.84RR18 pKa = 11.84KK19 pKa = 8.56LLRR22 pKa = 11.84KK23 pKa = 7.78TRR25 pKa = 11.84HH26 pKa = 3.65QRR28 pKa = 11.84RR29 pKa = 11.84NKK31 pKa = 9.78KK32 pKa = 9.85
Molecular weight: 4.08 kDa
Isoelectric point according different methods:
Peptides (in silico digests for buttom-up proteomics)
Below you can find in silico digests of the whole proteome with Trypsin, Chymotrypsin, Trypsin+LysC, LysN, ArgC proteases suitable for different mass spec machines.| Try ESI |
 |
|---|
| ChTry ESI |
 |
|---|
| ArgC ESI |
 |
|---|
| LysN ESI |
 |
|---|
| TryLysC ESI |
 |
|---|
| Try MALDI |
 |
|---|
| ChTry MALDI |
 |
|---|
| ArgC MALDI |
 |
|---|
| LysN MALDI |
 |
|---|
| TryLysC MALDI |
 |
|---|
| Try LTQ |
 |
|---|
| ChTry LTQ |
 |
|---|
| ArgC LTQ |
 |
|---|
| LysN LTQ |
 |
|---|
| TryLysC LTQ |
 |
|---|
| Try MSlow |
 |
|---|
| ChTry MSlow |
 |
|---|
| ArgC MSlow |
 |
|---|
| LysN MSlow |
 |
|---|
| TryLysC MSlow |
 |
|---|
| Try MShigh |
 |
|---|
| ChTry MShigh |
 |
|---|
| ArgC MShigh |
 |
|---|
| LysN MShigh |
 |
|---|
| TryLysC MShigh |
 |
|---|
General Statistics
Number of major isoforms |
Number of additional isoforms |
Number of all proteins |
Number of amino acids |
Min. Seq. Length |
Max. Seq. Length |
Avg. Seq. Length |
Avg. Mol. Weight |
|---|---|---|---|---|---|---|---|
0 |
1185822 |
30 |
2393 |
338.8 |
35.88 |
Amino acid frequency
Ala |
Cys |
Asp |
Glu |
Phe |
Gly |
His |
Ile |
Lys |
Leu |
|---|---|---|---|---|---|---|---|---|---|
15.151 ± 0.067 | 0.577 ± 0.01 |
6.268 ± 0.034 | 5.052 ± 0.036 |
2.618 ± 0.026 | 9.296 ± 0.035 |
2.113 ± 0.019 | 3.161 ± 0.031 |
1.538 ± 0.025 | 10.154 ± 0.043 |
Met |
Asn |
Gln |
Pro |
Arg |
Ser |
Thr |
Val |
Trp |
Tyr |
|---|---|---|---|---|---|---|---|---|---|
1.609 ± 0.015 | 1.569 ± 0.022 |
5.956 ± 0.034 | 2.756 ± 0.021 |
7.903 ± 0.047 | 4.897 ± 0.027 |
6.184 ± 0.035 | 9.867 ± 0.04 |
1.536 ± 0.018 | 1.794 ± 0.02 |
Most of the basic statistics you can see at this page can be downloaded from this CSV file
Proteome-pI is available under Creative Commons Attribution-NoDerivs license, for more details see here
| Reference: Kozlowski LP. Proteome-pI 2.0: Proteome Isoelectric Point Database Update. Nucleic Acids Res. 2021, doi: 10.1093/nar/gkab944 | Contact: Lukasz P. Kozlowski |
