Lactococcus lactis subsp. cremoris TIFN6
Taxonomy: cellular organisms; Bacteria; Terrabacteria group; Firmicutes; Bacilli; Lactobacillales; Streptococcaceae; Lactococcus; Lactococcus cremoris; Lactococcus cremoris subsp. cremoris
Average proteome isoelectric point is 6.63
Get precalculated fractions of proteins
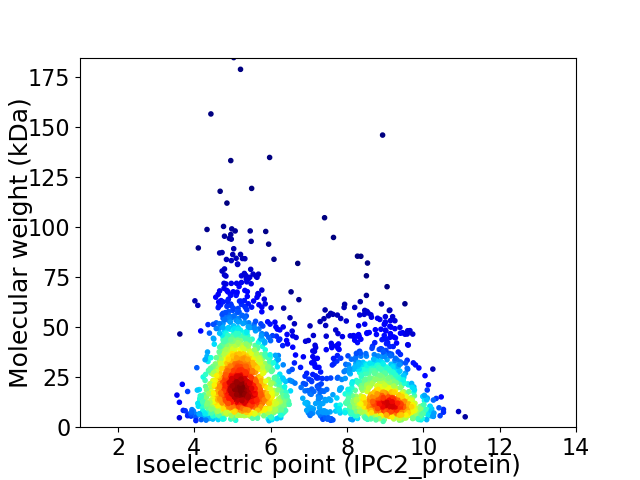
Virtual 2D-PAGE plot for 2310 proteins (isoelectric point calculated using IPC2_protein)
Get csv file with sequences according to given criteria:
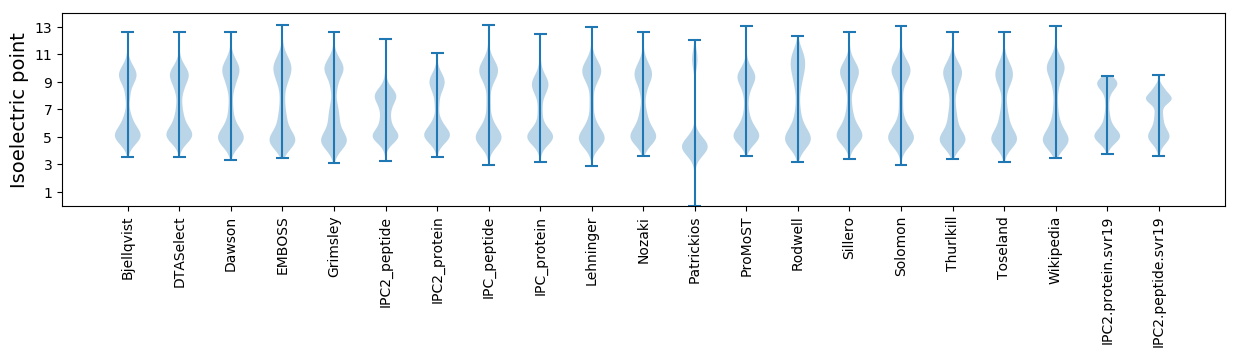
* You can choose from 21 different methods for calculating isoelectric point
Summary statistics related to proteome-wise predictions
Protein with the lowest isoelectric point:
>tr|T0SCT1|T0SCT1_LACLC dUTP diphosphatase OS=Lactococcus lactis subsp. cremoris TIFN6 OX=1234876 GN=dut PE=4 SV=1
MM1 pKa = 7.15THH3 pKa = 5.34THH5 pKa = 5.82DD6 pKa = 4.73HH7 pKa = 5.77EE8 pKa = 6.31HH9 pKa = 6.75DD10 pKa = 4.22HH11 pKa = 5.96NHH13 pKa = 5.56EE14 pKa = 4.18PDD16 pKa = 3.97YY17 pKa = 10.77ITLVDD22 pKa = 3.78EE23 pKa = 5.1NGNEE27 pKa = 4.21SLFQILITIDD37 pKa = 3.34GQEE40 pKa = 4.18EE41 pKa = 4.04FGKK44 pKa = 10.43NYY46 pKa = 10.08VVLQPTEE53 pKa = 4.16FEE55 pKa = 4.04EE56 pKa = 5.26DD57 pKa = 3.4EE58 pKa = 4.15QGLIDD63 pKa = 3.63VLAYY67 pKa = 10.87SFTEE71 pKa = 4.05NADD74 pKa = 3.34GTEE77 pKa = 4.48GDD79 pKa = 4.3LQPIPEE85 pKa = 4.52DD86 pKa = 5.82AEE88 pKa = 5.1DD89 pKa = 3.67EE90 pKa = 3.88WDD92 pKa = 3.68MIEE95 pKa = 4.26EE96 pKa = 4.3VFNSFMDD103 pKa = 3.8EE104 pKa = 4.16QEE106 pKa = 4.15DD107 pKa = 3.66
MM1 pKa = 7.15THH3 pKa = 5.34THH5 pKa = 5.82DD6 pKa = 4.73HH7 pKa = 5.77EE8 pKa = 6.31HH9 pKa = 6.75DD10 pKa = 4.22HH11 pKa = 5.96NHH13 pKa = 5.56EE14 pKa = 4.18PDD16 pKa = 3.97YY17 pKa = 10.77ITLVDD22 pKa = 3.78EE23 pKa = 5.1NGNEE27 pKa = 4.21SLFQILITIDD37 pKa = 3.34GQEE40 pKa = 4.18EE41 pKa = 4.04FGKK44 pKa = 10.43NYY46 pKa = 10.08VVLQPTEE53 pKa = 4.16FEE55 pKa = 4.04EE56 pKa = 5.26DD57 pKa = 3.4EE58 pKa = 4.15QGLIDD63 pKa = 3.63VLAYY67 pKa = 10.87SFTEE71 pKa = 4.05NADD74 pKa = 3.34GTEE77 pKa = 4.48GDD79 pKa = 4.3LQPIPEE85 pKa = 4.52DD86 pKa = 5.82AEE88 pKa = 5.1DD89 pKa = 3.67EE90 pKa = 3.88WDD92 pKa = 3.68MIEE95 pKa = 4.26EE96 pKa = 4.3VFNSFMDD103 pKa = 3.8EE104 pKa = 4.16QEE106 pKa = 4.15DD107 pKa = 3.66
Molecular weight: 12.43 kDa
Isoelectric point according different methods:
Protein with the highest isoelectric point:
>tr|T0TKB9|T0TKB9_LACLC Signal recognition particle protein OS=Lactococcus lactis subsp. cremoris TIFN6 OX=1234876 GN=ffh PE=3 SV=1
MM1 pKa = 7.28KK2 pKa = 9.42RR3 pKa = 11.84TYY5 pKa = 10.06QPHH8 pKa = 5.63KK9 pKa = 9.98KK10 pKa = 9.63SRR12 pKa = 11.84KK13 pKa = 4.36TTHH16 pKa = 6.07GFRR19 pKa = 11.84SRR21 pKa = 11.84MATKK25 pKa = 10.11NGRR28 pKa = 11.84RR29 pKa = 11.84VLAARR34 pKa = 11.84RR35 pKa = 11.84RR36 pKa = 11.84KK37 pKa = 9.65GRR39 pKa = 11.84ASLTVV44 pKa = 3.04
MM1 pKa = 7.28KK2 pKa = 9.42RR3 pKa = 11.84TYY5 pKa = 10.06QPHH8 pKa = 5.63KK9 pKa = 9.98KK10 pKa = 9.63SRR12 pKa = 11.84KK13 pKa = 4.36TTHH16 pKa = 6.07GFRR19 pKa = 11.84SRR21 pKa = 11.84MATKK25 pKa = 10.11NGRR28 pKa = 11.84RR29 pKa = 11.84VLAARR34 pKa = 11.84RR35 pKa = 11.84RR36 pKa = 11.84KK37 pKa = 9.65GRR39 pKa = 11.84ASLTVV44 pKa = 3.04
Molecular weight: 5.18 kDa
Isoelectric point according different methods:
Peptides (in silico digests for buttom-up proteomics)
Below you can find in silico digests of the whole proteome with Trypsin, Chymotrypsin, Trypsin+LysC, LysN, ArgC proteases suitable for different mass spec machines.| Try ESI |
 |
|---|
| ChTry ESI |
|
|---|
| ArgC ESI |
|
|---|
| LysN ESI |
|
|---|
| TryLysC ESI |
|
|---|
| Try MALDI |
|
|---|
| ChTry MALDI |
|
|---|
| ArgC MALDI |
|
|---|
| LysN MALDI |
|
|---|
| TryLysC MALDI |
|
|---|
| Try LTQ |
|
|---|
| ChTry LTQ |
|
|---|
| ArgC LTQ |
|
|---|
| LysN LTQ |
|
|---|
| TryLysC LTQ |
|
|---|
| Try MSlow |
|
|---|
| ChTry MSlow |
|
|---|
| ArgC MSlow |
|
|---|
| LysN MSlow |
|
|---|
| TryLysC MSlow |
|
|---|
| Try MShigh |
|
|---|
| ChTry MShigh |
|
|---|
| ArgC MShigh |
|
|---|
| LysN MShigh |
|
|---|
| TryLysC MShigh |
|
|---|
General Statistics
Number of major isoforms |
Number of additional isoforms |
Number of all proteins |
Number of amino acids |
Min. Seq. Length |
Max. Seq. Length |
Avg. Seq. Length |
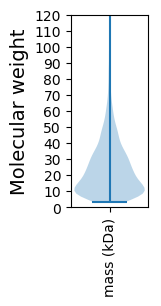
Avg. Mol. Weight |
|---|---|---|---|---|---|---|---|
0 |
515914 |
28 |
1635 |
223.3 |
25.06 |
Amino acid frequency
Ala |
Cys |
Asp |
Glu |
Phe |
Gly |
His |
Ile |
Lys |
Leu |
|---|---|---|---|---|---|---|---|---|---|
7.3 ± 0.064 | 0.502 ± 0.014 |
5.345 ± 0.048 | 7.044 ± 0.074 |
4.7 ± 0.042 | 6.532 ± 0.06 |
1.762 ± 0.023 | 7.517 ± 0.053 |
7.506 ± 0.061 | 9.755 ± 0.068 |
Met |
Asn |
Gln |
Pro |
Arg |
Ser |
Thr |
Val |
Trp |
Tyr |
|---|---|---|---|---|---|---|---|---|---|
2.596 ± 0.027 | 5.199 ± 0.046 |
3.254 ± 0.032 | 3.777 ± 0.031 |
3.748 ± 0.042 | 6.466 ± 0.054 |
5.776 ± 0.062 | 6.606 ± 0.049 |
0.986 ± 0.02 | 3.628 ± 0.041 |
Most of the basic statistics you can see at this page can be downloaded from this CSV file
See this proteome in:

Proteome-pI is available under Creative Commons Attribution-NoDerivs license, for more details see here
| Reference: Kozlowski LP. Proteome-pI 2.0: Proteome Isoelectric Point Database Update. Nucleic Acids Res. 2021, doi: 10.1093/nar/gkab944 | Contact: Lukasz P. Kozlowski |