Sphingomonas sp. Root710
Taxonomy: cellular organisms; Bacteria; Proteobacteria; Alphaproteobacteria; Sphingomonadales; Sphingomonadaceae; Sphingomonas; unclassified Sphingomonas
Average proteome isoelectric point is 6.54
Get precalculated fractions of proteins

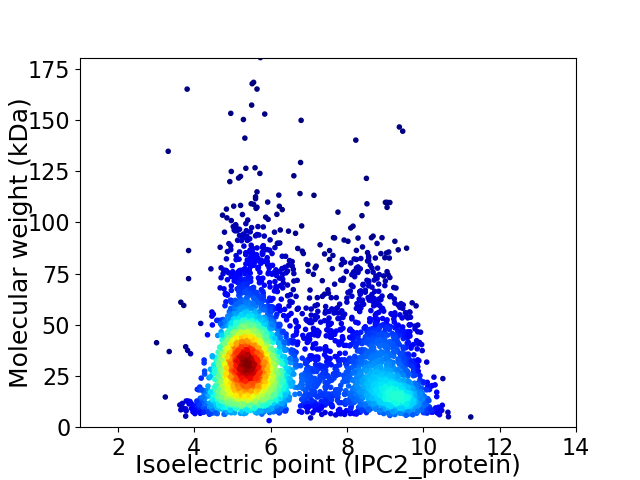
Virtual 2D-PAGE plot for 4422 proteins (isoelectric point calculated using IPC2_protein)
Get csv file with sequences according to given criteria:
* You can choose from 21 different methods for calculating isoelectric point
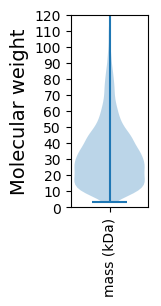
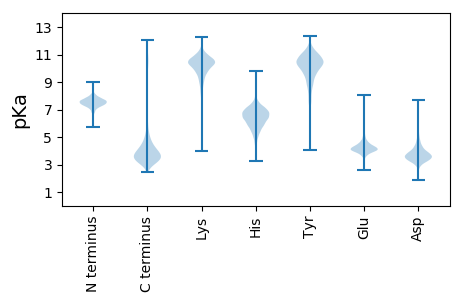
Summary statistics related to proteome-wise predictions


Protein with the lowest isoelectric point:
>tr|A0A0Q8QIU3|A0A0Q8QIU3_9SPHN 30S ribosomal protein S7 OS=Sphingomonas sp. Root710 OX=1736594 GN=rpsG PE=3 SV=1
MM1 pKa = 7.57ASINSVQDD9 pKa = 3.28QEE11 pKa = 4.45VTFISGVDD19 pKa = 3.42SSGRR23 pKa = 11.84AAPISFGTWNYY34 pKa = 10.81DD35 pKa = 3.16SPATYY40 pKa = 10.34DD41 pKa = 3.45GSAGNNYY48 pKa = 7.09TAKK51 pKa = 10.46FGPATSGTGATITYY65 pKa = 10.31AFDD68 pKa = 3.39IASNWTATEE77 pKa = 3.64KK78 pKa = 10.95AAFVATAKK86 pKa = 10.12LWSAVADD93 pKa = 3.72VTFVEE98 pKa = 5.19ASPSSAQVMLTRR110 pKa = 11.84STDD113 pKa = 3.15EE114 pKa = 4.3SASGGPDD121 pKa = 2.88RR122 pKa = 11.84FTTATTGTNQLGVASTASINIDD144 pKa = 3.26TTVAAFGPLGTSLSNYY160 pKa = 9.25GGYY163 pKa = 9.88PYY165 pKa = 7.97TTLIHH170 pKa = 6.04EE171 pKa = 4.6WGHH174 pKa = 5.02VLGLGHH180 pKa = 7.24GGPYY184 pKa = 10.0NAGDD188 pKa = 3.73VDD190 pKa = 3.84EE191 pKa = 4.7TPYY194 pKa = 10.89TGFDD198 pKa = 3.21NVAWTIMSYY207 pKa = 11.13NDD209 pKa = 3.68QSAEE213 pKa = 3.93WGVSRR218 pKa = 11.84GDD220 pKa = 3.57DD221 pKa = 3.28GLFYY225 pKa = 10.96GRR227 pKa = 11.84SPTTWMPLDD236 pKa = 4.41IIAAQRR242 pKa = 11.84LYY244 pKa = 10.8GVAVNTPLSGGQVYY258 pKa = 9.83GFNSNITGEE267 pKa = 3.91IAKK270 pKa = 10.19FFDD273 pKa = 4.27FNQNTRR279 pKa = 11.84PIVTLWNKK287 pKa = 9.28GVNNTLDD294 pKa = 3.39LSGTSFASTVDD305 pKa = 3.19MHH307 pKa = 7.29DD308 pKa = 3.58GAFSSVMNLEE318 pKa = 4.59DD319 pKa = 3.93NLAIAYY325 pKa = 6.76GTRR328 pKa = 11.84IDD330 pKa = 3.94TVITGAGGDD339 pKa = 3.65MVTGNDD345 pKa = 3.04NSNYY349 pKa = 9.44VLAGAGADD357 pKa = 3.89SIIGGSGNDD366 pKa = 3.68HH367 pKa = 7.19LYY369 pKa = 10.6GAAAVAVAGDD379 pKa = 3.76GADD382 pKa = 3.87TIGGGAGSDD391 pKa = 3.89YY392 pKa = 11.01IQGNAGDD399 pKa = 4.31DD400 pKa = 3.66RR401 pKa = 11.84LNGGDD406 pKa = 3.64GSDD409 pKa = 4.61RR410 pKa = 11.84IQGGQGNDD418 pKa = 3.87SILGDD423 pKa = 4.04AGNDD427 pKa = 3.54TTNGNLGNDD436 pKa = 4.12SIDD439 pKa = 3.48GGEE442 pKa = 4.5GNDD445 pKa = 4.02SLRR448 pKa = 11.84GGQGADD454 pKa = 3.79SITGGIGNDD463 pKa = 3.43MLLGDD468 pKa = 5.13LGVDD472 pKa = 3.71TLSGGAGIDD481 pKa = 3.75LMSGGGDD488 pKa = 3.22PDD490 pKa = 2.94IFTFAEE496 pKa = 4.43GDD498 pKa = 3.27ASFGNGSATDD508 pKa = 3.99VITDD512 pKa = 4.02FTDD515 pKa = 4.37EE516 pKa = 4.06IDD518 pKa = 4.6HH519 pKa = 6.22IHH521 pKa = 6.02MAFGLPSAVLHH532 pKa = 6.06GAAADD537 pKa = 3.93SFAQAAASAQQILNGQAGFTDD558 pKa = 3.8VAVLQVGTDD567 pKa = 3.08VYY569 pKa = 11.39LFYY572 pKa = 10.37DD573 pKa = 4.07TGAAAPLEE581 pKa = 4.47AIRR584 pKa = 11.84LGGIADD590 pKa = 3.8AAVITITDD598 pKa = 4.05FTT600 pKa = 4.45
MM1 pKa = 7.57ASINSVQDD9 pKa = 3.28QEE11 pKa = 4.45VTFISGVDD19 pKa = 3.42SSGRR23 pKa = 11.84AAPISFGTWNYY34 pKa = 10.81DD35 pKa = 3.16SPATYY40 pKa = 10.34DD41 pKa = 3.45GSAGNNYY48 pKa = 7.09TAKK51 pKa = 10.46FGPATSGTGATITYY65 pKa = 10.31AFDD68 pKa = 3.39IASNWTATEE77 pKa = 3.64KK78 pKa = 10.95AAFVATAKK86 pKa = 10.12LWSAVADD93 pKa = 3.72VTFVEE98 pKa = 5.19ASPSSAQVMLTRR110 pKa = 11.84STDD113 pKa = 3.15EE114 pKa = 4.3SASGGPDD121 pKa = 2.88RR122 pKa = 11.84FTTATTGTNQLGVASTASINIDD144 pKa = 3.26TTVAAFGPLGTSLSNYY160 pKa = 9.25GGYY163 pKa = 9.88PYY165 pKa = 7.97TTLIHH170 pKa = 6.04EE171 pKa = 4.6WGHH174 pKa = 5.02VLGLGHH180 pKa = 7.24GGPYY184 pKa = 10.0NAGDD188 pKa = 3.73VDD190 pKa = 3.84EE191 pKa = 4.7TPYY194 pKa = 10.89TGFDD198 pKa = 3.21NVAWTIMSYY207 pKa = 11.13NDD209 pKa = 3.68QSAEE213 pKa = 3.93WGVSRR218 pKa = 11.84GDD220 pKa = 3.57DD221 pKa = 3.28GLFYY225 pKa = 10.96GRR227 pKa = 11.84SPTTWMPLDD236 pKa = 4.41IIAAQRR242 pKa = 11.84LYY244 pKa = 10.8GVAVNTPLSGGQVYY258 pKa = 9.83GFNSNITGEE267 pKa = 3.91IAKK270 pKa = 10.19FFDD273 pKa = 4.27FNQNTRR279 pKa = 11.84PIVTLWNKK287 pKa = 9.28GVNNTLDD294 pKa = 3.39LSGTSFASTVDD305 pKa = 3.19MHH307 pKa = 7.29DD308 pKa = 3.58GAFSSVMNLEE318 pKa = 4.59DD319 pKa = 3.93NLAIAYY325 pKa = 6.76GTRR328 pKa = 11.84IDD330 pKa = 3.94TVITGAGGDD339 pKa = 3.65MVTGNDD345 pKa = 3.04NSNYY349 pKa = 9.44VLAGAGADD357 pKa = 3.89SIIGGSGNDD366 pKa = 3.68HH367 pKa = 7.19LYY369 pKa = 10.6GAAAVAVAGDD379 pKa = 3.76GADD382 pKa = 3.87TIGGGAGSDD391 pKa = 3.89YY392 pKa = 11.01IQGNAGDD399 pKa = 4.31DD400 pKa = 3.66RR401 pKa = 11.84LNGGDD406 pKa = 3.64GSDD409 pKa = 4.61RR410 pKa = 11.84IQGGQGNDD418 pKa = 3.87SILGDD423 pKa = 4.04AGNDD427 pKa = 3.54TTNGNLGNDD436 pKa = 4.12SIDD439 pKa = 3.48GGEE442 pKa = 4.5GNDD445 pKa = 4.02SLRR448 pKa = 11.84GGQGADD454 pKa = 3.79SITGGIGNDD463 pKa = 3.43MLLGDD468 pKa = 5.13LGVDD472 pKa = 3.71TLSGGAGIDD481 pKa = 3.75LMSGGGDD488 pKa = 3.22PDD490 pKa = 2.94IFTFAEE496 pKa = 4.43GDD498 pKa = 3.27ASFGNGSATDD508 pKa = 3.99VITDD512 pKa = 4.02FTDD515 pKa = 4.37EE516 pKa = 4.06IDD518 pKa = 4.6HH519 pKa = 6.22IHH521 pKa = 6.02MAFGLPSAVLHH532 pKa = 6.06GAAADD537 pKa = 3.93SFAQAAASAQQILNGQAGFTDD558 pKa = 3.8VAVLQVGTDD567 pKa = 3.08VYY569 pKa = 11.39LFYY572 pKa = 10.37DD573 pKa = 4.07TGAAAPLEE581 pKa = 4.47AIRR584 pKa = 11.84LGGIADD590 pKa = 3.8AAVITITDD598 pKa = 4.05FTT600 pKa = 4.45
Molecular weight: 60.97 kDa
Isoelectric point according different methods:
Protein with the highest isoelectric point:
>tr|A0A0Q8QBP1|A0A0Q8QBP1_9SPHN RES domain-containing protein OS=Sphingomonas sp. Root710 OX=1736594 GN=ASE00_20535 PE=3 SV=1
MM1 pKa = 7.45KK2 pKa = 9.61RR3 pKa = 11.84TFQPSNLVRR12 pKa = 11.84KK13 pKa = 8.96RR14 pKa = 11.84RR15 pKa = 11.84HH16 pKa = 4.61GFRR19 pKa = 11.84SRR21 pKa = 11.84SATPGGRR28 pKa = 11.84KK29 pKa = 9.04VLAARR34 pKa = 11.84RR35 pKa = 11.84ARR37 pKa = 11.84GRR39 pKa = 11.84AKK41 pKa = 10.7LSAA44 pKa = 4.0
MM1 pKa = 7.45KK2 pKa = 9.61RR3 pKa = 11.84TFQPSNLVRR12 pKa = 11.84KK13 pKa = 8.96RR14 pKa = 11.84RR15 pKa = 11.84HH16 pKa = 4.61GFRR19 pKa = 11.84SRR21 pKa = 11.84SATPGGRR28 pKa = 11.84KK29 pKa = 9.04VLAARR34 pKa = 11.84RR35 pKa = 11.84ARR37 pKa = 11.84GRR39 pKa = 11.84AKK41 pKa = 10.7LSAA44 pKa = 4.0
Molecular weight: 4.99 kDa
Isoelectric point according different methods:
Peptides (in silico digests for buttom-up proteomics)
Below you can find in silico digests of the whole proteome with Trypsin, Chymotrypsin, Trypsin+LysC, LysN, ArgC proteases suitable for different mass spec machines.| Try ESI |
 |
|---|
| ChTry ESI |
 |
|---|
| ArgC ESI |
 |
|---|
| LysN ESI |
 |
|---|
| TryLysC ESI |
 |
|---|
| Try MALDI |
 |
|---|
| ChTry MALDI |
 |
|---|
| ArgC MALDI |
 |
|---|
| LysN MALDI |
 |
|---|
| TryLysC MALDI |
 |
|---|
| Try LTQ |
 |
|---|
| ChTry LTQ |
 |
|---|
| ArgC LTQ |
 |
|---|
| LysN LTQ |
 |
|---|
| TryLysC LTQ |
 |
|---|
| Try MSlow |
 |
|---|
| ChTry MSlow |
 |
|---|
| ArgC MSlow |
 |
|---|
| LysN MSlow |
 |
|---|
| TryLysC MSlow |
 |
|---|
| Try MShigh |
 |
|---|
| ChTry MShigh |
 |
|---|
| ArgC MShigh |
 |
|---|
| LysN MShigh |
 |
|---|
| TryLysC MShigh |
 |
|---|
General Statistics
Number of major isoforms |
Number of additional isoforms |
Number of all proteins |
Number of amino acids |
Min. Seq. Length |
Max. Seq. Length |
Avg. Seq. Length |
Avg. Mol. Weight |
|---|---|---|---|---|---|---|---|
0 |
1395197 |
29 |
1722 |
315.5 |
34.12 |
Amino acid frequency
Ala |
Cys |
Asp |
Glu |
Phe |
Gly |
His |
Ile |
Lys |
Leu |
|---|---|---|---|---|---|---|---|---|---|
13.257 ± 0.051 | 0.796 ± 0.01 |
6.084 ± 0.029 | 5.308 ± 0.032 |
3.56 ± 0.021 | 8.923 ± 0.035 |
2.052 ± 0.018 | 5.39 ± 0.022 |
3.023 ± 0.027 | 9.845 ± 0.042 |
Met |
Asn |
Gln |
Pro |
Arg |
Ser |
Thr |
Val |
Trp |
Tyr |
|---|---|---|---|---|---|---|---|---|---|
2.458 ± 0.017 | 2.532 ± 0.025 |
5.253 ± 0.028 | 3.016 ± 0.019 |
7.419 ± 0.038 | 5.348 ± 0.029 |
5.058 ± 0.03 | 6.96 ± 0.03 |
1.384 ± 0.014 | 2.332 ± 0.02 |
Most of the basic statistics you can see at this page can be downloaded from this CSV file
Proteome-pI is available under Creative Commons Attribution-NoDerivs license, for more details see here
| Reference: Kozlowski LP. Proteome-pI 2.0: Proteome Isoelectric Point Database Update. Nucleic Acids Res. 2021, doi: 10.1093/nar/gkab944 | Contact: Lukasz P. Kozlowski |
