Subdoligranulum sp. 4_3_54A2FAA
Taxonomy: cellular organisms; Bacteria; Terrabacteria group; Firmicutes; Clostridia; Eubacteriales; Oscillospiraceae; Subdoligranulum; unclassified Subdoligranulum
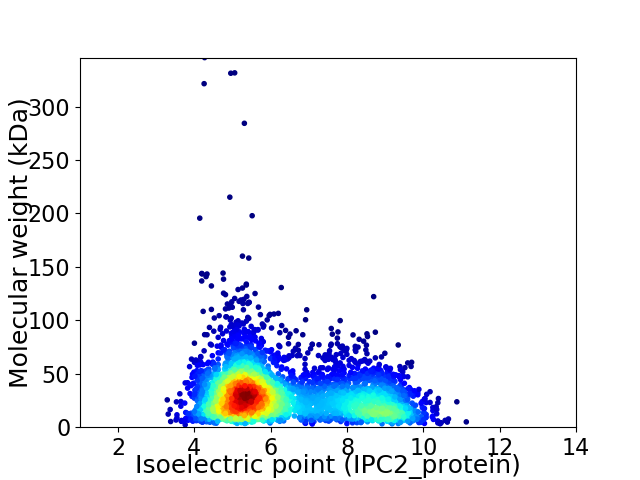
Average proteome isoelectric point is 6.32
Get precalculated fractions of proteins

Virtual 2D-PAGE plot for 4088 proteins (isoelectric point calculated using IPC2_protein)
Get csv file with sequences according to given criteria:
* You can choose from 21 different methods for calculating isoelectric point
Summary statistics related to proteome-wise predictions


Protein with the lowest isoelectric point:
>tr|G9RZ40|G9RZ40_9FIRM Ribosomal RNA large subunit methyltransferase H OS=Subdoligranulum sp. 4_3_54A2FAA OX=665956 GN=rlmH PE=3 SV=1
MM1 pKa = 7.6KK2 pKa = 10.32KK3 pKa = 10.15FLSAALALCLAFSLAACGGSGSSTPASTAPSGGTAGSGAAIKK45 pKa = 10.31IGGIGPVTGSTAVYY59 pKa = 10.39GNAVKK64 pKa = 10.71NGAEE68 pKa = 3.78IAIAEE73 pKa = 4.17INALGGQQYY82 pKa = 9.75EE83 pKa = 4.5MKK85 pKa = 10.79FEE87 pKa = 5.07DD88 pKa = 5.22DD89 pKa = 3.68EE90 pKa = 5.95NDD92 pKa = 3.22AEE94 pKa = 4.58KK95 pKa = 10.65AINAYY100 pKa = 10.54NSLKK104 pKa = 10.63DD105 pKa = 3.09WGMQILMGTVTSNPCIAVAAEE126 pKa = 3.95TANDD130 pKa = 3.44NMFQLTPSGSAEE142 pKa = 3.79GCIANDD148 pKa = 3.07NAFRR152 pKa = 11.84VCFSDD157 pKa = 4.11PEE159 pKa = 4.17QGTLSADD166 pKa = 3.68YY167 pKa = 10.51IVEE170 pKa = 3.95NSLAAKK176 pKa = 9.92VAVIYY181 pKa = 10.42DD182 pKa = 3.41SSDD185 pKa = 3.39PYY187 pKa = 11.48SSGIHH192 pKa = 6.31DD193 pKa = 4.22AFVTEE198 pKa = 4.17AQEE201 pKa = 4.06KK202 pKa = 8.61GLEE205 pKa = 4.3VVSDD209 pKa = 3.69EE210 pKa = 5.56AFTADD215 pKa = 3.31SNKK218 pKa = 10.56DD219 pKa = 3.2FTVQIQKK226 pKa = 10.2AQSAGAEE233 pKa = 4.23LVFLPIYY240 pKa = 8.57YY241 pKa = 9.49TEE243 pKa = 4.69ASLILTQADD252 pKa = 3.8KK253 pKa = 10.88IGYY256 pKa = 8.18EE257 pKa = 4.14PVFFGCDD264 pKa = 3.37GLDD267 pKa = 3.21GLVSVEE273 pKa = 4.68NFDD276 pKa = 3.43TSLAEE281 pKa = 4.87DD282 pKa = 4.02VMLMTPFTASATDD295 pKa = 3.52DD296 pKa = 3.29KK297 pKa = 11.23TAAFVKK303 pKa = 10.22AYY305 pKa = 10.49NEE307 pKa = 4.44AYY309 pKa = 10.41GEE311 pKa = 4.43DD312 pKa = 4.09PNQFAADD319 pKa = 3.99AYY321 pKa = 9.65DD322 pKa = 4.66AIYY325 pKa = 9.98AIHH328 pKa = 6.69AAVEE332 pKa = 4.35KK333 pKa = 10.95AGVTADD339 pKa = 3.45MDD341 pKa = 3.76ASAICDD347 pKa = 3.59ALKK350 pKa = 10.69AAFTEE355 pKa = 4.32ITLEE359 pKa = 4.01GLTGKK364 pKa = 10.82GITWDD369 pKa = 3.44ASGAPAKK376 pKa = 10.72SPLVYY381 pKa = 9.97IIKK384 pKa = 10.5DD385 pKa = 3.64GVYY388 pKa = 8.96TAAA391 pKa = 4.95
MM1 pKa = 7.6KK2 pKa = 10.32KK3 pKa = 10.15FLSAALALCLAFSLAACGGSGSSTPASTAPSGGTAGSGAAIKK45 pKa = 10.31IGGIGPVTGSTAVYY59 pKa = 10.39GNAVKK64 pKa = 10.71NGAEE68 pKa = 3.78IAIAEE73 pKa = 4.17INALGGQQYY82 pKa = 9.75EE83 pKa = 4.5MKK85 pKa = 10.79FEE87 pKa = 5.07DD88 pKa = 5.22DD89 pKa = 3.68EE90 pKa = 5.95NDD92 pKa = 3.22AEE94 pKa = 4.58KK95 pKa = 10.65AINAYY100 pKa = 10.54NSLKK104 pKa = 10.63DD105 pKa = 3.09WGMQILMGTVTSNPCIAVAAEE126 pKa = 3.95TANDD130 pKa = 3.44NMFQLTPSGSAEE142 pKa = 3.79GCIANDD148 pKa = 3.07NAFRR152 pKa = 11.84VCFSDD157 pKa = 4.11PEE159 pKa = 4.17QGTLSADD166 pKa = 3.68YY167 pKa = 10.51IVEE170 pKa = 3.95NSLAAKK176 pKa = 9.92VAVIYY181 pKa = 10.42DD182 pKa = 3.41SSDD185 pKa = 3.39PYY187 pKa = 11.48SSGIHH192 pKa = 6.31DD193 pKa = 4.22AFVTEE198 pKa = 4.17AQEE201 pKa = 4.06KK202 pKa = 8.61GLEE205 pKa = 4.3VVSDD209 pKa = 3.69EE210 pKa = 5.56AFTADD215 pKa = 3.31SNKK218 pKa = 10.56DD219 pKa = 3.2FTVQIQKK226 pKa = 10.2AQSAGAEE233 pKa = 4.23LVFLPIYY240 pKa = 8.57YY241 pKa = 9.49TEE243 pKa = 4.69ASLILTQADD252 pKa = 3.8KK253 pKa = 10.88IGYY256 pKa = 8.18EE257 pKa = 4.14PVFFGCDD264 pKa = 3.37GLDD267 pKa = 3.21GLVSVEE273 pKa = 4.68NFDD276 pKa = 3.43TSLAEE281 pKa = 4.87DD282 pKa = 4.02VMLMTPFTASATDD295 pKa = 3.52DD296 pKa = 3.29KK297 pKa = 11.23TAAFVKK303 pKa = 10.22AYY305 pKa = 10.49NEE307 pKa = 4.44AYY309 pKa = 10.41GEE311 pKa = 4.43DD312 pKa = 4.09PNQFAADD319 pKa = 3.99AYY321 pKa = 9.65DD322 pKa = 4.66AIYY325 pKa = 9.98AIHH328 pKa = 6.69AAVEE332 pKa = 4.35KK333 pKa = 10.95AGVTADD339 pKa = 3.45MDD341 pKa = 3.76ASAICDD347 pKa = 3.59ALKK350 pKa = 10.69AAFTEE355 pKa = 4.32ITLEE359 pKa = 4.01GLTGKK364 pKa = 10.82GITWDD369 pKa = 3.44ASGAPAKK376 pKa = 10.72SPLVYY381 pKa = 9.97IIKK384 pKa = 10.5DD385 pKa = 3.64GVYY388 pKa = 8.96TAAA391 pKa = 4.95
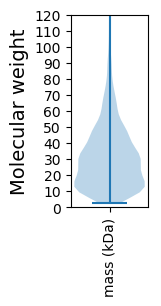
Molecular weight: 40.5 kDa
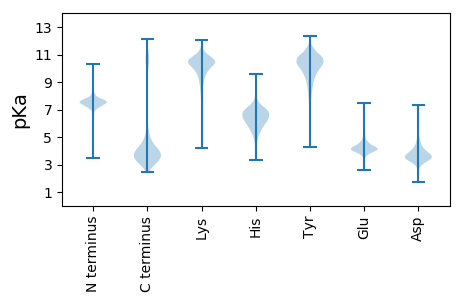
Isoelectric point according different methods:
Protein with the highest isoelectric point:
>tr|G9RT72|G9RT72_9FIRM CotJB domain-containing protein OS=Subdoligranulum sp. 4_3_54A2FAA OX=665956 GN=HMPREF1032_02756 PE=4 SV=1
MM1 pKa = 7.45KK2 pKa = 9.6RR3 pKa = 11.84TFQPKK8 pKa = 8.8KK9 pKa = 7.95RR10 pKa = 11.84HH11 pKa = 5.88RR12 pKa = 11.84ATKK15 pKa = 9.91HH16 pKa = 4.97GFLARR21 pKa = 11.84SKK23 pKa = 10.53SSNGRR28 pKa = 11.84KK29 pKa = 9.13VLAARR34 pKa = 11.84RR35 pKa = 11.84AKK37 pKa = 10.35GRR39 pKa = 11.84AKK41 pKa = 10.44LAAA44 pKa = 4.52
MM1 pKa = 7.45KK2 pKa = 9.6RR3 pKa = 11.84TFQPKK8 pKa = 8.8KK9 pKa = 7.95RR10 pKa = 11.84HH11 pKa = 5.88RR12 pKa = 11.84ATKK15 pKa = 9.91HH16 pKa = 4.97GFLARR21 pKa = 11.84SKK23 pKa = 10.53SSNGRR28 pKa = 11.84KK29 pKa = 9.13VLAARR34 pKa = 11.84RR35 pKa = 11.84AKK37 pKa = 10.35GRR39 pKa = 11.84AKK41 pKa = 10.44LAAA44 pKa = 4.52
Molecular weight: 4.97 kDa
Isoelectric point according different methods:
Peptides (in silico digests for buttom-up proteomics)
Below you can find in silico digests of the whole proteome with Trypsin, Chymotrypsin, Trypsin+LysC, LysN, ArgC proteases suitable for different mass spec machines.| Try ESI |
 |
|---|
| ChTry ESI |
 |
|---|
| ArgC ESI |
 |
|---|
| LysN ESI |
 |
|---|
| TryLysC ESI |
 |
|---|
| Try MALDI |
 |
|---|
| ChTry MALDI |
 |
|---|
| ArgC MALDI |
 |
|---|
| LysN MALDI |
 |
|---|
| TryLysC MALDI |
 |
|---|
| Try LTQ |
 |
|---|
| ChTry LTQ |
 |
|---|
| ArgC LTQ |
 |
|---|
| LysN LTQ |
 |
|---|
| TryLysC LTQ |
 |
|---|
| Try MSlow |
 |
|---|
| ChTry MSlow |
 |
|---|
| ArgC MSlow |
 |
|---|
| LysN MSlow |
 |
|---|
| TryLysC MSlow |
 |
|---|
| Try MShigh |
 |
|---|
| ChTry MShigh |
 |
|---|
| ArgC MShigh |
 |
|---|
| LysN MShigh |
 |
|---|
| TryLysC MShigh |
 |
|---|
General Statistics
Number of major isoforms |
Number of additional isoforms |
Number of all proteins |
Number of amino acids |
Min. Seq. Length |
Max. Seq. Length |
Avg. Seq. Length |
Avg. Mol. Weight |
|---|---|---|---|---|---|---|---|
0 |
1219814 |
24 |
3194 |
298.4 |
32.96 |
Amino acid frequency
Ala |
Cys |
Asp |
Glu |
Phe |
Gly |
His |
Ile |
Lys |
Leu |
|---|---|---|---|---|---|---|---|---|---|
10.568 ± 0.058 | 1.734 ± 0.017 |
5.398 ± 0.028 | 6.637 ± 0.04 |
3.998 ± 0.027 | 7.766 ± 0.039 |
1.82 ± 0.019 | 5.216 ± 0.043 |
4.797 ± 0.033 | 9.629 ± 0.047 |
Met |
Asn |
Gln |
Pro |
Arg |
Ser |
Thr |
Val |
Trp |
Tyr |
|---|---|---|---|---|---|---|---|---|---|
2.79 ± 0.021 | 3.418 ± 0.025 |
4.249 ± 0.029 | 3.39 ± 0.027 |
5.839 ± 0.041 | 5.355 ± 0.029 |
5.408 ± 0.034 | 7.108 ± 0.032 |
1.151 ± 0.015 | 3.727 ± 0.029 |
Most of the basic statistics you can see at this page can be downloaded from this CSV file
Proteome-pI is available under Creative Commons Attribution-NoDerivs license, for more details see here
| Reference: Kozlowski LP. Proteome-pI 2.0: Proteome Isoelectric Point Database Update. Nucleic Acids Res. 2021, doi: 10.1093/nar/gkab944 | Contact: Lukasz P. Kozlowski |
