Eel virus European X
Taxonomy: Viruses; Riboviria; Orthornavirae; Negarnaviricota; Haploviricotina; Monjiviricetes; Mononegavirales; Rhabdoviridae; Alpharhabdovirinae; Perhabdovirus; Anguillid perhabdovirus
Average proteome isoelectric point is 6.55
Get precalculated fractions of proteins

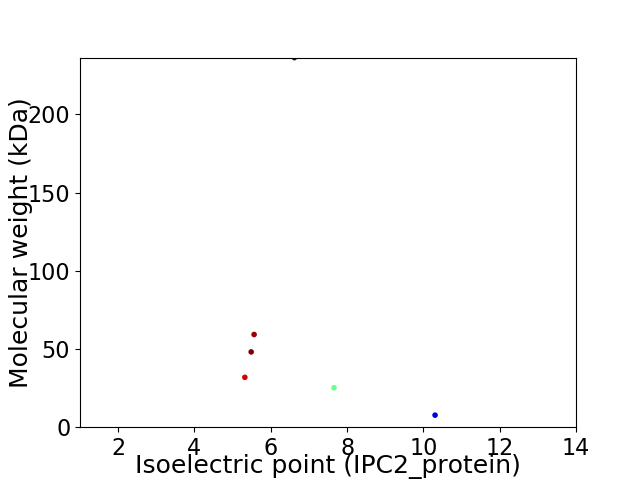
Virtual 2D-PAGE plot for 6 proteins (isoelectric point calculated using IPC2_protein)
Get csv file with sequences according to given criteria:
* You can choose from 21 different methods for calculating isoelectric point
Summary statistics related to proteome-wise predictions


Protein with the lowest isoelectric point:
>tr|E3P8Y9|E3P8Y9_9RHAB Matrix protein OS=Eel virus European X OX=685443 GN=M PE=4 SV=1
MM1 pKa = 7.7LSSNKK6 pKa = 9.74NKK8 pKa = 10.54NKK10 pKa = 9.91FDD12 pKa = 4.06LEE14 pKa = 4.66GIQLLAKK21 pKa = 9.49GVKK24 pKa = 9.47NAGEE28 pKa = 4.39SIDD31 pKa = 3.71RR32 pKa = 11.84ATDD35 pKa = 3.29EE36 pKa = 4.54KK37 pKa = 11.1PEE39 pKa = 4.25HH40 pKa = 6.59LSDD43 pKa = 3.96AFSKK47 pKa = 8.74YY48 pKa = 8.33TEE50 pKa = 4.15YY51 pKa = 11.13LSNEE55 pKa = 4.18SKK57 pKa = 11.03EE58 pKa = 4.13EE59 pKa = 3.91EE60 pKa = 3.87EE61 pKa = 5.03DD62 pKa = 3.84FQFEE66 pKa = 4.08QVDD69 pKa = 3.61YY70 pKa = 10.89GFQEE74 pKa = 4.35SPEE77 pKa = 4.46SNNPLQEE84 pKa = 3.7SWIAKK89 pKa = 9.99DD90 pKa = 4.5DD91 pKa = 4.23LEE93 pKa = 6.42PDD95 pKa = 3.32MGKK98 pKa = 9.4SWVEE102 pKa = 3.85YY103 pKa = 7.15QAKK106 pKa = 9.7MSFDD110 pKa = 3.62YY111 pKa = 11.28NEE113 pKa = 4.06QVKK116 pKa = 8.14PTVMRR121 pKa = 11.84EE122 pKa = 3.8INGLLGMLGGFAKK135 pKa = 10.61FQDD138 pKa = 3.73GKK140 pKa = 11.04KK141 pKa = 9.96EE142 pKa = 3.84YY143 pKa = 10.82LFYY146 pKa = 11.05LPEE149 pKa = 5.29KK150 pKa = 10.37KK151 pKa = 10.17EE152 pKa = 4.13SEE154 pKa = 4.13EE155 pKa = 3.85RR156 pKa = 11.84RR157 pKa = 11.84SDD159 pKa = 3.99KK160 pKa = 10.63KK161 pKa = 10.39QCPFKK166 pKa = 11.23VDD168 pKa = 3.41VTPKK172 pKa = 9.75QDD174 pKa = 3.58PKK176 pKa = 10.15ITPTPEE182 pKa = 3.98KK183 pKa = 10.08EE184 pKa = 4.35PKK186 pKa = 9.95HH187 pKa = 6.35LPTSAAGKK195 pKa = 10.21KK196 pKa = 8.11ITEE199 pKa = 4.32EE200 pKa = 3.81AAVMQGFWMDD210 pKa = 3.21GMRR213 pKa = 11.84LTEE216 pKa = 4.1KK217 pKa = 10.39TSGKK221 pKa = 9.88YY222 pKa = 10.29CLFFPQKK229 pKa = 9.69MGWSQAEE236 pKa = 4.38WISKK240 pKa = 10.46SEE242 pKa = 4.59DD243 pKa = 3.04INPRR247 pKa = 11.84TLAHH251 pKa = 7.51DD252 pKa = 3.38IFKK255 pKa = 10.62WMVSKK260 pKa = 10.77SPKK263 pKa = 8.38RR264 pKa = 11.84ATYY267 pKa = 8.97LRR269 pKa = 11.84KK270 pKa = 10.42YY271 pKa = 9.04MVEE274 pKa = 4.0EE275 pKa = 4.06
MM1 pKa = 7.7LSSNKK6 pKa = 9.74NKK8 pKa = 10.54NKK10 pKa = 9.91FDD12 pKa = 4.06LEE14 pKa = 4.66GIQLLAKK21 pKa = 9.49GVKK24 pKa = 9.47NAGEE28 pKa = 4.39SIDD31 pKa = 3.71RR32 pKa = 11.84ATDD35 pKa = 3.29EE36 pKa = 4.54KK37 pKa = 11.1PEE39 pKa = 4.25HH40 pKa = 6.59LSDD43 pKa = 3.96AFSKK47 pKa = 8.74YY48 pKa = 8.33TEE50 pKa = 4.15YY51 pKa = 11.13LSNEE55 pKa = 4.18SKK57 pKa = 11.03EE58 pKa = 4.13EE59 pKa = 3.91EE60 pKa = 3.87EE61 pKa = 5.03DD62 pKa = 3.84FQFEE66 pKa = 4.08QVDD69 pKa = 3.61YY70 pKa = 10.89GFQEE74 pKa = 4.35SPEE77 pKa = 4.46SNNPLQEE84 pKa = 3.7SWIAKK89 pKa = 9.99DD90 pKa = 4.5DD91 pKa = 4.23LEE93 pKa = 6.42PDD95 pKa = 3.32MGKK98 pKa = 9.4SWVEE102 pKa = 3.85YY103 pKa = 7.15QAKK106 pKa = 9.7MSFDD110 pKa = 3.62YY111 pKa = 11.28NEE113 pKa = 4.06QVKK116 pKa = 8.14PTVMRR121 pKa = 11.84EE122 pKa = 3.8INGLLGMLGGFAKK135 pKa = 10.61FQDD138 pKa = 3.73GKK140 pKa = 11.04KK141 pKa = 9.96EE142 pKa = 3.84YY143 pKa = 10.82LFYY146 pKa = 11.05LPEE149 pKa = 5.29KK150 pKa = 10.37KK151 pKa = 10.17EE152 pKa = 4.13SEE154 pKa = 4.13EE155 pKa = 3.85RR156 pKa = 11.84RR157 pKa = 11.84SDD159 pKa = 3.99KK160 pKa = 10.63KK161 pKa = 10.39QCPFKK166 pKa = 11.23VDD168 pKa = 3.41VTPKK172 pKa = 9.75QDD174 pKa = 3.58PKK176 pKa = 10.15ITPTPEE182 pKa = 3.98KK183 pKa = 10.08EE184 pKa = 4.35PKK186 pKa = 9.95HH187 pKa = 6.35LPTSAAGKK195 pKa = 10.21KK196 pKa = 8.11ITEE199 pKa = 4.32EE200 pKa = 3.81AAVMQGFWMDD210 pKa = 3.21GMRR213 pKa = 11.84LTEE216 pKa = 4.1KK217 pKa = 10.39TSGKK221 pKa = 9.88YY222 pKa = 10.29CLFFPQKK229 pKa = 9.69MGWSQAEE236 pKa = 4.38WISKK240 pKa = 10.46SEE242 pKa = 4.59DD243 pKa = 3.04INPRR247 pKa = 11.84TLAHH251 pKa = 7.51DD252 pKa = 3.38IFKK255 pKa = 10.62WMVSKK260 pKa = 10.77SPKK263 pKa = 8.38RR264 pKa = 11.84ATYY267 pKa = 8.97LRR269 pKa = 11.84KK270 pKa = 10.42YY271 pKa = 9.04MVEE274 pKa = 4.0EE275 pKa = 4.06
Molecular weight: 31.88 kDa
Isoelectric point according different methods:
Protein with the highest isoelectric point:
>tr|E3P8Z2|E3P8Z2_9RHAB Putative coat protein OS=Eel virus European X OX=685443 GN=C PE=4 SV=1
MM1 pKa = 7.11EE2 pKa = 5.53RR3 pKa = 11.84KK4 pKa = 9.94NIFSIFQRR12 pKa = 11.84RR13 pKa = 11.84KK14 pKa = 6.97SQKK17 pKa = 9.56RR18 pKa = 11.84EE19 pKa = 3.43GLIRR23 pKa = 11.84NNVLSRR29 pKa = 11.84LMSPQNKK36 pKa = 6.21TQKK39 pKa = 10.49SLPHH43 pKa = 6.03LRR45 pKa = 11.84KK46 pKa = 9.68SQNICPHH53 pKa = 5.34QLPAKK58 pKa = 9.79KK59 pKa = 10.11SPKK62 pKa = 9.31KK63 pKa = 10.51QPP65 pKa = 3.17
MM1 pKa = 7.11EE2 pKa = 5.53RR3 pKa = 11.84KK4 pKa = 9.94NIFSIFQRR12 pKa = 11.84RR13 pKa = 11.84KK14 pKa = 6.97SQKK17 pKa = 9.56RR18 pKa = 11.84EE19 pKa = 3.43GLIRR23 pKa = 11.84NNVLSRR29 pKa = 11.84LMSPQNKK36 pKa = 6.21TQKK39 pKa = 10.49SLPHH43 pKa = 6.03LRR45 pKa = 11.84KK46 pKa = 9.68SQNICPHH53 pKa = 5.34QLPAKK58 pKa = 9.79KK59 pKa = 10.11SPKK62 pKa = 9.31KK63 pKa = 10.51QPP65 pKa = 3.17
Molecular weight: 7.71 kDa
Isoelectric point according different methods:
Peptides (in silico digests for buttom-up proteomics)
Below you can find in silico digests of the whole proteome with Trypsin, Chymotrypsin, Trypsin+LysC, LysN, ArgC proteases suitable for different mass spec machines.| Try ESI |
 |
|---|
| ChTry ESI |
 |
|---|
| ArgC ESI |
 |
|---|
| LysN ESI |
 |
|---|
| TryLysC ESI |
 |
|---|
| Try MALDI |
 |
|---|
| ChTry MALDI |
 |
|---|
| ArgC MALDI |
 |
|---|
| LysN MALDI |
 |
|---|
| TryLysC MALDI |
 |
|---|
| Try LTQ |
 |
|---|
| ChTry LTQ |
 |
|---|
| ArgC LTQ |
 |
|---|
| LysN LTQ |
 |
|---|
| TryLysC LTQ |
 |
|---|
| Try MSlow |
 |
|---|
| ChTry MSlow |
 |
|---|
| ArgC MSlow |
 |
|---|
| LysN MSlow |
 |
|---|
| TryLysC MSlow |
 |
|---|
| Try MShigh |
 |
|---|
| ChTry MShigh |
 |
|---|
| ArgC MShigh |
 |
|---|
| LysN MShigh |
 |
|---|
| TryLysC MShigh |
 |
|---|
General Statistics
Number of major isoforms |
Number of additional isoforms |
Number of all proteins |
Number of amino acids |
Min. Seq. Length |
Max. Seq. Length |
Avg. Seq. Length |
Avg. Mol. Weight |
|---|---|---|---|---|---|---|---|
0 |
3596 |
65 |
2075 |
599.3 |
68.07 |
Amino acid frequency
Ala |
Cys |
Asp |
Glu |
Phe |
Gly |
His |
Ile |
Lys |
Leu |
|---|---|---|---|---|---|---|---|---|---|
5.617 ± 0.446 | 1.39 ± 0.197 |
5.395 ± 0.329 | 6.618 ± 0.566 |
3.921 ± 0.428 | 5.729 ± 0.386 |
2.614 ± 0.311 | 6.062 ± 0.472 |
6.618 ± 0.704 | 9.789 ± 0.614 |
Met |
Asn |
Gln |
Pro |
Arg |
Ser |
Thr |
Val |
Trp |
Tyr |
|---|---|---|---|---|---|---|---|---|---|
2.781 ± 0.378 | 4.533 ± 0.259 |
4.505 ± 0.549 | 4.283 ± 0.262 |
5.089 ± 0.469 | 8.788 ± 0.463 |
5.562 ± 0.483 | 5.478 ± 0.597 |
1.974 ± 0.17 | 3.254 ± 0.358 |
Most of the basic statistics you can see at this page can be downloaded from this CSV file
Proteome-pI is available under Creative Commons Attribution-NoDerivs license, for more details see here
| Reference: Kozlowski LP. Proteome-pI 2.0: Proteome Isoelectric Point Database Update. Nucleic Acids Res. 2021, doi: 10.1093/nar/gkab944 | Contact: Lukasz P. Kozlowski |
