Labrenzia sp. VG12
Taxonomy: cellular organisms; Bacteria; Proteobacteria; Alphaproteobacteria; Hyphomicrobiales; Stappiaceae; Labrenzia; unclassified Labrenzia
Average proteome isoelectric point is 6.02
Get precalculated fractions of proteins

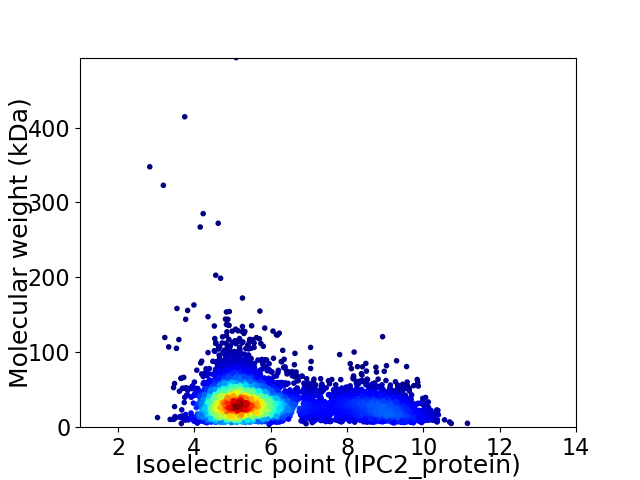
Virtual 2D-PAGE plot for 5332 proteins (isoelectric point calculated using IPC2_protein)
Get csv file with sequences according to given criteria:
* You can choose from 21 different methods for calculating isoelectric point
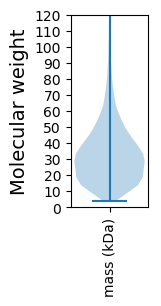
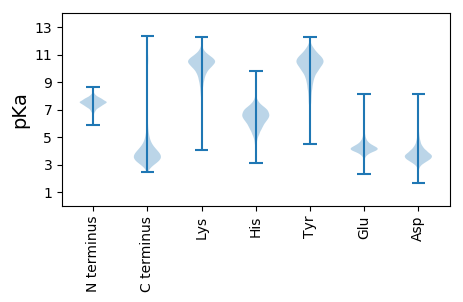
Summary statistics related to proteome-wise predictions


Protein with the lowest isoelectric point:
>tr|A0A222F4J6|A0A222F4J6_9RHOB TetR family transcriptional regulator OS=Labrenzia sp. VG12 OX=2021862 GN=CHH27_11005 PE=4 SV=1
MM1 pKa = 7.81TDD3 pKa = 3.04QNSAKK8 pKa = 9.04PASAAAPKK16 pKa = 10.21PSFTNEE22 pKa = 3.89QIAHH26 pKa = 5.81QLTDD30 pKa = 3.49NFWIRR35 pKa = 11.84EE36 pKa = 4.32GEE38 pKa = 4.08PTRR41 pKa = 11.84HH42 pKa = 5.86FDD44 pKa = 3.27IPVGGTITVNYY55 pKa = 10.32AGLTQKK61 pKa = 10.76GQFYY65 pKa = 10.75AHH67 pKa = 6.8YY68 pKa = 10.38ALEE71 pKa = 4.28LWSDD75 pKa = 3.29VTGIQFVTTRR85 pKa = 11.84GQADD89 pKa = 3.27IMFDD93 pKa = 3.51DD94 pKa = 4.49WDD96 pKa = 3.93SGAYY100 pKa = 9.37AHH102 pKa = 7.13SNLKK106 pKa = 10.35SDD108 pKa = 3.76GSIDD112 pKa = 3.46QSFVNVSTSWISSDD126 pKa = 3.95GYY128 pKa = 11.31NLSNYY133 pKa = 9.79SFQTYY138 pKa = 7.42IHH140 pKa = 7.13EE141 pKa = 4.6IGHH144 pKa = 6.42ALGLGHH150 pKa = 7.58AGNYY154 pKa = 9.13NGSADD159 pKa = 3.71YY160 pKa = 11.15GIDD163 pKa = 3.34NDD165 pKa = 4.1YY166 pKa = 11.84ANDD169 pKa = 3.25SWQATVMSYY178 pKa = 10.2FSQTEE183 pKa = 3.84NTAILADD190 pKa = 4.23FAYY193 pKa = 10.65VATPQVADD201 pKa = 3.39VMAIRR206 pKa = 11.84EE207 pKa = 4.47LYY209 pKa = 10.42GSSGDD214 pKa = 3.5TRR216 pKa = 11.84TSDD219 pKa = 3.16TVYY222 pKa = 11.05GDD224 pKa = 3.17NGTAGSIMNHH234 pKa = 6.65IIGNSTPTTYY244 pKa = 10.45TIVDD248 pKa = 3.82DD249 pKa = 5.21GGTDD253 pKa = 3.42TLNFADD259 pKa = 4.17TGQDD263 pKa = 3.01QTIDD267 pKa = 3.59LRR269 pKa = 11.84EE270 pKa = 3.76QAISSVRR277 pKa = 11.84GVDD280 pKa = 3.27GNLIIAEE287 pKa = 4.23GTRR290 pKa = 11.84IEE292 pKa = 4.11NAISGSGNDD301 pKa = 4.58LIVANDD307 pKa = 3.9LQNVLTGGAGNDD319 pKa = 2.54RR320 pKa = 11.84FVFHH324 pKa = 7.65DD325 pKa = 4.16AASHH329 pKa = 5.68SANLDD334 pKa = 3.66TITDD338 pKa = 4.12FEE340 pKa = 5.59DD341 pKa = 5.15GSDD344 pKa = 4.49LICFVDD350 pKa = 4.99DD351 pKa = 4.58DD352 pKa = 4.78FGPALSFGLLDD363 pKa = 4.56FSAVGSDD370 pKa = 3.98VSIQFNDD377 pKa = 4.03DD378 pKa = 4.05RR379 pKa = 11.84ILLEE383 pKa = 4.15NVSLASLDD391 pKa = 3.73VNDD394 pKa = 4.49FLFVV398 pKa = 3.25
MM1 pKa = 7.81TDD3 pKa = 3.04QNSAKK8 pKa = 9.04PASAAAPKK16 pKa = 10.21PSFTNEE22 pKa = 3.89QIAHH26 pKa = 5.81QLTDD30 pKa = 3.49NFWIRR35 pKa = 11.84EE36 pKa = 4.32GEE38 pKa = 4.08PTRR41 pKa = 11.84HH42 pKa = 5.86FDD44 pKa = 3.27IPVGGTITVNYY55 pKa = 10.32AGLTQKK61 pKa = 10.76GQFYY65 pKa = 10.75AHH67 pKa = 6.8YY68 pKa = 10.38ALEE71 pKa = 4.28LWSDD75 pKa = 3.29VTGIQFVTTRR85 pKa = 11.84GQADD89 pKa = 3.27IMFDD93 pKa = 3.51DD94 pKa = 4.49WDD96 pKa = 3.93SGAYY100 pKa = 9.37AHH102 pKa = 7.13SNLKK106 pKa = 10.35SDD108 pKa = 3.76GSIDD112 pKa = 3.46QSFVNVSTSWISSDD126 pKa = 3.95GYY128 pKa = 11.31NLSNYY133 pKa = 9.79SFQTYY138 pKa = 7.42IHH140 pKa = 7.13EE141 pKa = 4.6IGHH144 pKa = 6.42ALGLGHH150 pKa = 7.58AGNYY154 pKa = 9.13NGSADD159 pKa = 3.71YY160 pKa = 11.15GIDD163 pKa = 3.34NDD165 pKa = 4.1YY166 pKa = 11.84ANDD169 pKa = 3.25SWQATVMSYY178 pKa = 10.2FSQTEE183 pKa = 3.84NTAILADD190 pKa = 4.23FAYY193 pKa = 10.65VATPQVADD201 pKa = 3.39VMAIRR206 pKa = 11.84EE207 pKa = 4.47LYY209 pKa = 10.42GSSGDD214 pKa = 3.5TRR216 pKa = 11.84TSDD219 pKa = 3.16TVYY222 pKa = 11.05GDD224 pKa = 3.17NGTAGSIMNHH234 pKa = 6.65IIGNSTPTTYY244 pKa = 10.45TIVDD248 pKa = 3.82DD249 pKa = 5.21GGTDD253 pKa = 3.42TLNFADD259 pKa = 4.17TGQDD263 pKa = 3.01QTIDD267 pKa = 3.59LRR269 pKa = 11.84EE270 pKa = 3.76QAISSVRR277 pKa = 11.84GVDD280 pKa = 3.27GNLIIAEE287 pKa = 4.23GTRR290 pKa = 11.84IEE292 pKa = 4.11NAISGSGNDD301 pKa = 4.58LIVANDD307 pKa = 3.9LQNVLTGGAGNDD319 pKa = 2.54RR320 pKa = 11.84FVFHH324 pKa = 7.65DD325 pKa = 4.16AASHH329 pKa = 5.68SANLDD334 pKa = 3.66TITDD338 pKa = 4.12FEE340 pKa = 5.59DD341 pKa = 5.15GSDD344 pKa = 4.49LICFVDD350 pKa = 4.99DD351 pKa = 4.58DD352 pKa = 4.78FGPALSFGLLDD363 pKa = 4.56FSAVGSDD370 pKa = 3.98VSIQFNDD377 pKa = 4.03DD378 pKa = 4.05RR379 pKa = 11.84ILLEE383 pKa = 4.15NVSLASLDD391 pKa = 3.73VNDD394 pKa = 4.49FLFVV398 pKa = 3.25
Molecular weight: 42.86 kDa
Isoelectric point according different methods:
Protein with the highest isoelectric point:
>tr|A0A222FBQ6|A0A222FBQ6_9RHOB Alpha/beta hydrolase OS=Labrenzia sp. VG12 OX=2021862 GN=CHH27_25360 PE=4 SV=1
MM1 pKa = 7.35KK2 pKa = 9.4RR3 pKa = 11.84TYY5 pKa = 10.2QPSRR9 pKa = 11.84LVRR12 pKa = 11.84KK13 pKa = 9.21RR14 pKa = 11.84RR15 pKa = 11.84HH16 pKa = 4.48GFRR19 pKa = 11.84ARR21 pKa = 11.84MATKK25 pKa = 10.4NGRR28 pKa = 11.84QVLARR33 pKa = 11.84RR34 pKa = 11.84RR35 pKa = 11.84AKK37 pKa = 10.15GRR39 pKa = 11.84KK40 pKa = 8.87SLSAA44 pKa = 3.86
MM1 pKa = 7.35KK2 pKa = 9.4RR3 pKa = 11.84TYY5 pKa = 10.2QPSRR9 pKa = 11.84LVRR12 pKa = 11.84KK13 pKa = 9.21RR14 pKa = 11.84RR15 pKa = 11.84HH16 pKa = 4.48GFRR19 pKa = 11.84ARR21 pKa = 11.84MATKK25 pKa = 10.4NGRR28 pKa = 11.84QVLARR33 pKa = 11.84RR34 pKa = 11.84RR35 pKa = 11.84AKK37 pKa = 10.15GRR39 pKa = 11.84KK40 pKa = 8.87SLSAA44 pKa = 3.86
Molecular weight: 5.24 kDa
Isoelectric point according different methods:
Peptides (in silico digests for buttom-up proteomics)
Below you can find in silico digests of the whole proteome with Trypsin, Chymotrypsin, Trypsin+LysC, LysN, ArgC proteases suitable for different mass spec machines.| Try ESI |
 |
|---|
| ChTry ESI |
 |
|---|
| ArgC ESI |
 |
|---|
| LysN ESI |
 |
|---|
| TryLysC ESI |
 |
|---|
| Try MALDI |
 |
|---|
| ChTry MALDI |
 |
|---|
| ArgC MALDI |
 |
|---|
| LysN MALDI |
 |
|---|
| TryLysC MALDI |
 |
|---|
| Try LTQ |
 |
|---|
| ChTry LTQ |
 |
|---|
| ArgC LTQ |
 |
|---|
| LysN LTQ |
 |
|---|
| TryLysC LTQ |
 |
|---|
| Try MSlow |
 |
|---|
| ChTry MSlow |
 |
|---|
| ArgC MSlow |
 |
|---|
| LysN MSlow |
 |
|---|
| TryLysC MSlow |
 |
|---|
| Try MShigh |
 |
|---|
| ChTry MShigh |
 |
|---|
| ArgC MShigh |
 |
|---|
| LysN MShigh |
 |
|---|
| TryLysC MShigh |
 |
|---|
General Statistics
Number of major isoforms |
Number of additional isoforms |
Number of all proteins |
Number of amino acids |
Min. Seq. Length |
Max. Seq. Length |
Avg. Seq. Length |
Avg. Mol. Weight |
|---|---|---|---|---|---|---|---|
0 |
1710563 |
35 |
4569 |
320.8 |
34.95 |
Amino acid frequency
Ala |
Cys |
Asp |
Glu |
Phe |
Gly |
His |
Ile |
Lys |
Leu |
|---|---|---|---|---|---|---|---|---|---|
11.351 ± 0.041 | 0.897 ± 0.011 |
6.191 ± 0.041 | 6.17 ± 0.036 |
4.018 ± 0.024 | 8.335 ± 0.031 |
1.979 ± 0.017 | 5.169 ± 0.026 |
3.741 ± 0.028 | 10.37 ± 0.044 |
Met |
Asn |
Gln |
Pro |
Arg |
Ser |
Thr |
Val |
Trp |
Tyr |
|---|---|---|---|---|---|---|---|---|---|
2.426 ± 0.017 | 2.836 ± 0.019 |
4.856 ± 0.024 | 3.315 ± 0.019 |
6.246 ± 0.035 | 5.736 ± 0.024 |
5.515 ± 0.034 | 7.274 ± 0.029 |
1.281 ± 0.014 | 2.294 ± 0.016 |
Most of the basic statistics you can see at this page can be downloaded from this CSV file
Proteome-pI is available under Creative Commons Attribution-NoDerivs license, for more details see here
| Reference: Kozlowski LP. Proteome-pI 2.0: Proteome Isoelectric Point Database Update. Nucleic Acids Res. 2021, doi: 10.1093/nar/gkab944 | Contact: Lukasz P. Kozlowski |
