Ectocarpus siliculosus virus 1 (isolate New Zealand/Kaikoura/1988) (EsV-1)
Taxonomy: Viruses; Varidnaviria; Bamfordvirae; Nucleocytoviricota; Megaviricetes; Algavirales; Phycodnaviridae; Phaeovirus; Ectocarpus siliculosus virus 1
Average proteome isoelectric point is 6.97
Get precalculated fractions of proteins

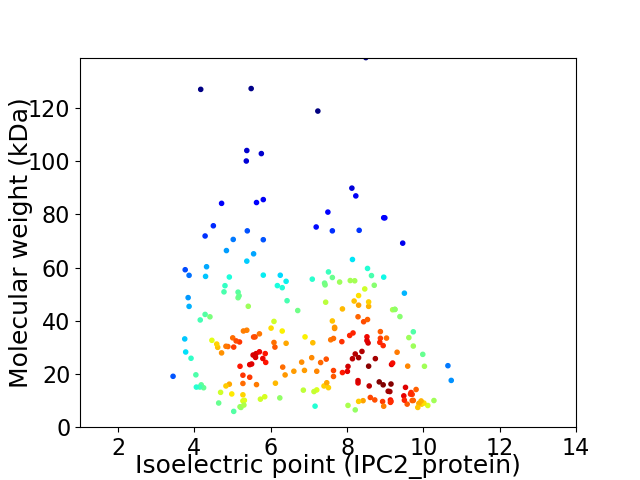
Virtual 2D-PAGE plot for 231 proteins (isoelectric point calculated using IPC2_protein)
Get csv file with sequences according to given criteria:
* You can choose from 21 different methods for calculating isoelectric point
Summary statistics related to proteome-wise predictions


Protein with the lowest isoelectric point:
>tr|Q8QKV5|Q8QKV5_ESV1K EsV-1-97 OS=Ectocarpus siliculosus virus 1 (isolate New Zealand/Kaikoura/1988) OX=654926 GN=ORF 97 PE=4 SV=1
MM1 pKa = 7.74FSILYY6 pKa = 6.07NTNMLGLAKK15 pKa = 10.34SILLLLTSGLHH26 pKa = 6.44CGHH29 pKa = 7.41ASLTVTTPEE38 pKa = 3.64EE39 pKa = 4.07DD40 pKa = 3.4LVVVSGRR47 pKa = 11.84TFTVRR52 pKa = 11.84WNQDD56 pKa = 3.42DD57 pKa = 4.05GSTTYY62 pKa = 11.12SRR64 pKa = 11.84FAIDD68 pKa = 4.19LYY70 pKa = 10.84QYY72 pKa = 10.89QSYY75 pKa = 11.53AMDD78 pKa = 4.28EE79 pKa = 4.38DD80 pKa = 4.7SCGSWVTALCPYY92 pKa = 10.14GEE94 pKa = 4.49RR95 pKa = 11.84GCPDD99 pKa = 2.74STGDD103 pKa = 3.59YY104 pKa = 10.94DD105 pKa = 4.41VVLPEE110 pKa = 4.79PATDD114 pKa = 5.02LPDD117 pKa = 3.05STYY120 pKa = 10.58RR121 pKa = 11.84IGVLGVEE128 pKa = 4.97DD129 pKa = 4.81GSFGCSDD136 pKa = 3.75KK137 pKa = 10.65FTLTTEE143 pKa = 4.01QATSKK148 pKa = 11.28DD149 pKa = 3.16PDD151 pKa = 3.51KK152 pKa = 11.5YY153 pKa = 10.36FLSVTAPADD162 pKa = 3.23GDD164 pKa = 3.95VAVIGDD170 pKa = 3.85TYY172 pKa = 10.98EE173 pKa = 3.96VQFSYY178 pKa = 11.4EE179 pKa = 4.02NGVGSSADD187 pKa = 3.35VFDD190 pKa = 4.96IDD192 pKa = 6.15LFTSDD197 pKa = 3.94CGTYY201 pKa = 10.36VAGLCDD207 pKa = 3.31QCKK210 pKa = 10.51DD211 pKa = 3.44SGGSHH216 pKa = 7.62PIIIPMDD223 pKa = 3.63TDD225 pKa = 3.47ADD227 pKa = 4.54FYY229 pKa = 10.47RR230 pKa = 11.84IRR232 pKa = 11.84VARR235 pKa = 11.84VEE237 pKa = 4.39DD238 pKa = 4.27PFLFDD243 pKa = 3.33CSGVFEE249 pKa = 4.55VVDD252 pKa = 3.29ILSFSFWW259 pKa = 3.86
MM1 pKa = 7.74FSILYY6 pKa = 6.07NTNMLGLAKK15 pKa = 10.34SILLLLTSGLHH26 pKa = 6.44CGHH29 pKa = 7.41ASLTVTTPEE38 pKa = 3.64EE39 pKa = 4.07DD40 pKa = 3.4LVVVSGRR47 pKa = 11.84TFTVRR52 pKa = 11.84WNQDD56 pKa = 3.42DD57 pKa = 4.05GSTTYY62 pKa = 11.12SRR64 pKa = 11.84FAIDD68 pKa = 4.19LYY70 pKa = 10.84QYY72 pKa = 10.89QSYY75 pKa = 11.53AMDD78 pKa = 4.28EE79 pKa = 4.38DD80 pKa = 4.7SCGSWVTALCPYY92 pKa = 10.14GEE94 pKa = 4.49RR95 pKa = 11.84GCPDD99 pKa = 2.74STGDD103 pKa = 3.59YY104 pKa = 10.94DD105 pKa = 4.41VVLPEE110 pKa = 4.79PATDD114 pKa = 5.02LPDD117 pKa = 3.05STYY120 pKa = 10.58RR121 pKa = 11.84IGVLGVEE128 pKa = 4.97DD129 pKa = 4.81GSFGCSDD136 pKa = 3.75KK137 pKa = 10.65FTLTTEE143 pKa = 4.01QATSKK148 pKa = 11.28DD149 pKa = 3.16PDD151 pKa = 3.51KK152 pKa = 11.5YY153 pKa = 10.36FLSVTAPADD162 pKa = 3.23GDD164 pKa = 3.95VAVIGDD170 pKa = 3.85TYY172 pKa = 10.98EE173 pKa = 3.96VQFSYY178 pKa = 11.4EE179 pKa = 4.02NGVGSSADD187 pKa = 3.35VFDD190 pKa = 4.96IDD192 pKa = 6.15LFTSDD197 pKa = 3.94CGTYY201 pKa = 10.36VAGLCDD207 pKa = 3.31QCKK210 pKa = 10.51DD211 pKa = 3.44SGGSHH216 pKa = 7.62PIIIPMDD223 pKa = 3.63TDD225 pKa = 3.47ADD227 pKa = 4.54FYY229 pKa = 10.47RR230 pKa = 11.84IRR232 pKa = 11.84VARR235 pKa = 11.84VEE237 pKa = 4.39DD238 pKa = 4.27PFLFDD243 pKa = 3.33CSGVFEE249 pKa = 4.55VVDD252 pKa = 3.29ILSFSFWW259 pKa = 3.86
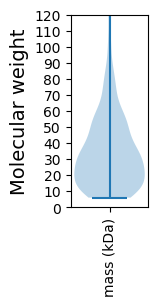
Molecular weight: 28.28 kDa
Isoelectric point according different methods:
Protein with the highest isoelectric point:
>tr|Q8QNH8|Q8QNH8_ESV1K EsV-1-100 OS=Ectocarpus siliculosus virus 1 (isolate New Zealand/Kaikoura/1988) OX=654926 GN=ORF 100 PE=4 SV=1
MM1 pKa = 7.67HH2 pKa = 7.13SMKK5 pKa = 10.18ILKK8 pKa = 9.71NDD10 pKa = 2.72RR11 pKa = 11.84RR12 pKa = 11.84YY13 pKa = 10.21FLARR17 pKa = 11.84DD18 pKa = 3.35VLQRR22 pKa = 11.84ILHH25 pKa = 5.49KK26 pKa = 10.96VPLLFDD32 pKa = 3.55PRR34 pKa = 11.84GRR36 pKa = 11.84WRR38 pKa = 11.84CRR40 pKa = 11.84HH41 pKa = 5.54FEE43 pKa = 4.0ATFSCIRR50 pKa = 11.84LPTPLLPGACLRR62 pKa = 11.84LQRR65 pKa = 11.84RR66 pKa = 11.84TRR68 pKa = 11.84PLLVALDD75 pKa = 4.49NIRR78 pKa = 11.84QQLVEE83 pKa = 4.12VSTLGEE89 pKa = 3.89ILVVGVTRR97 pKa = 11.84PYY99 pKa = 10.58HH100 pKa = 5.22VLHH103 pKa = 6.76EE104 pKa = 4.66GSEE107 pKa = 4.22EE108 pKa = 4.14VLWVVAIVPVASVVRR123 pKa = 11.84QKK125 pKa = 11.54KK126 pKa = 9.96LVDD129 pKa = 3.27
MM1 pKa = 7.67HH2 pKa = 7.13SMKK5 pKa = 10.18ILKK8 pKa = 9.71NDD10 pKa = 2.72RR11 pKa = 11.84RR12 pKa = 11.84YY13 pKa = 10.21FLARR17 pKa = 11.84DD18 pKa = 3.35VLQRR22 pKa = 11.84ILHH25 pKa = 5.49KK26 pKa = 10.96VPLLFDD32 pKa = 3.55PRR34 pKa = 11.84GRR36 pKa = 11.84WRR38 pKa = 11.84CRR40 pKa = 11.84HH41 pKa = 5.54FEE43 pKa = 4.0ATFSCIRR50 pKa = 11.84LPTPLLPGACLRR62 pKa = 11.84LQRR65 pKa = 11.84RR66 pKa = 11.84TRR68 pKa = 11.84PLLVALDD75 pKa = 4.49NIRR78 pKa = 11.84QQLVEE83 pKa = 4.12VSTLGEE89 pKa = 3.89ILVVGVTRR97 pKa = 11.84PYY99 pKa = 10.58HH100 pKa = 5.22VLHH103 pKa = 6.76EE104 pKa = 4.66GSEE107 pKa = 4.22EE108 pKa = 4.14VLWVVAIVPVASVVRR123 pKa = 11.84QKK125 pKa = 11.54KK126 pKa = 9.96LVDD129 pKa = 3.27
Molecular weight: 14.98 kDa
Isoelectric point according different methods:
Peptides (in silico digests for buttom-up proteomics)
Below you can find in silico digests of the whole proteome with Trypsin, Chymotrypsin, Trypsin+LysC, LysN, ArgC proteases suitable for different mass spec machines.| Try ESI |
 |
|---|
| ChTry ESI |
 |
|---|
| ArgC ESI |
 |
|---|
| LysN ESI |
 |
|---|
| TryLysC ESI |
 |
|---|
| Try MALDI |
 |
|---|
| ChTry MALDI |
 |
|---|
| ArgC MALDI |
 |
|---|
| LysN MALDI |
 |
|---|
| TryLysC MALDI |
 |
|---|
| Try LTQ |
 |
|---|
| ChTry LTQ |
 |
|---|
| ArgC LTQ |
 |
|---|
| LysN LTQ |
 |
|---|
| TryLysC LTQ |
 |
|---|
| Try MSlow |
 |
|---|
| ChTry MSlow |
 |
|---|
| ArgC MSlow |
 |
|---|
| LysN MSlow |
 |
|---|
| TryLysC MSlow |
 |
|---|
| Try MShigh |
 |
|---|
| ChTry MShigh |
 |
|---|
| ArgC MShigh |
 |
|---|
| LysN MShigh |
 |
|---|
| TryLysC MShigh |
 |
|---|
General Statistics
Number of major isoforms |
Number of additional isoforms |
Number of all proteins |
Number of amino acids |
Min. Seq. Length |
Max. Seq. Length |
Avg. Seq. Length |
Avg. Mol. Weight |
|---|---|---|---|---|---|---|---|
0 |
73957 |
53 |
1233 |
320.2 |
35.62 |
Amino acid frequency
Ala |
Cys |
Asp |
Glu |
Phe |
Gly |
His |
Ile |
Lys |
Leu |
|---|---|---|---|---|---|---|---|---|---|
7.625 ± 0.195 | 2.092 ± 0.094 |
6.145 ± 0.132 | 5.906 ± 0.203 |
4.09 ± 0.116 | 6.527 ± 0.174 |
2.488 ± 0.076 | 5.064 ± 0.115 |
5.89 ± 0.277 | 8.152 ± 0.152 |
Met |
Asn |
Gln |
Pro |
Arg |
Ser |
Thr |
Val |
Trp |
Tyr |
|---|---|---|---|---|---|---|---|---|---|
2.779 ± 0.068 | 4.093 ± 0.105 |
4.104 ± 0.145 | 3.244 ± 0.125 |
6.147 ± 0.173 | 8.155 ± 0.195 |
6.2 ± 0.144 | 7.519 ± 0.126 |
0.972 ± 0.044 | 2.81 ± 0.096 |
Most of the basic statistics you can see at this page can be downloaded from this CSV file
Proteome-pI is available under Creative Commons Attribution-NoDerivs license, for more details see here
| Reference: Kozlowski LP. Proteome-pI 2.0: Proteome Isoelectric Point Database Update. Nucleic Acids Res. 2021, doi: 10.1093/nar/gkab944 | Contact: Lukasz P. Kozlowski |
