Lachnospiraceae bacterium OF09-33XD
Taxonomy: cellular organisms; Bacteria; Terrabacteria group; Firmicutes; Clostridia; Eubacteriales; Lachnospiraceae; unclassified Lachnospiraceae
Average proteome isoelectric point is 6.08
Get precalculated fractions of proteins

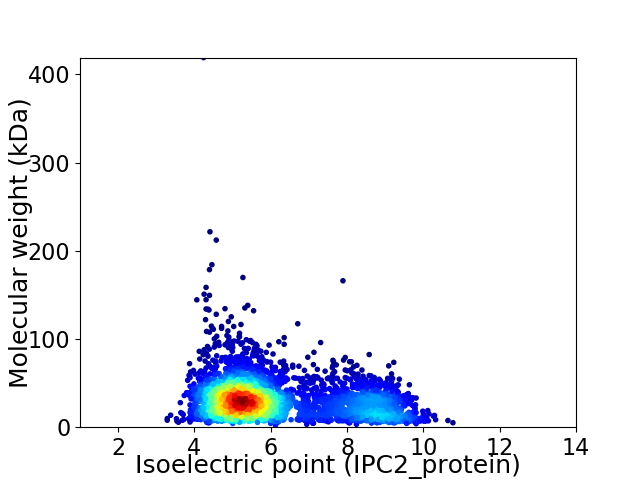
Virtual 2D-PAGE plot for 3402 proteins (isoelectric point calculated using IPC2_protein)
Get csv file with sequences according to given criteria:
* You can choose from 21 different methods for calculating isoelectric point
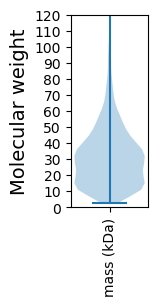
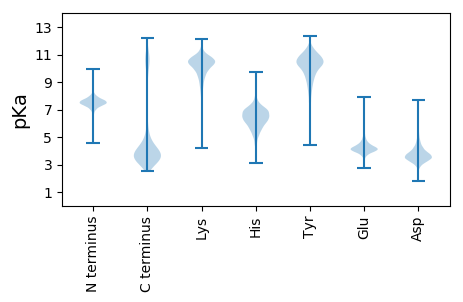
Summary statistics related to proteome-wise predictions


Protein with the lowest isoelectric point:
>tr|A0A396QA61|A0A396QA61_9FIRM Uncharacterized protein OS=Lachnospiraceae bacterium OF09-33XD OX=2292273 GN=DXA96_19885 PE=4 SV=1
MM1 pKa = 7.43KK2 pKa = 10.32KK3 pKa = 10.21VLAVTAAAAMGLSLTACSGGAASGSGSDD31 pKa = 3.58SSGASSASGATSVQGASAPSDD52 pKa = 3.49SSSVSGGTAAKK63 pKa = 8.62DD64 pKa = 3.36TYY66 pKa = 10.66KK67 pKa = 10.47IAVVKK72 pKa = 10.88QMDD75 pKa = 4.03HH76 pKa = 6.87ASLDD80 pKa = 4.11EE81 pKa = 4.03IAGAVTAEE89 pKa = 4.11LDD91 pKa = 3.78VIAEE95 pKa = 4.25EE96 pKa = 3.84NHH98 pKa = 4.88ITIEE102 pKa = 4.2YY103 pKa = 9.49EE104 pKa = 4.2VYY106 pKa = 10.46SGQGEE111 pKa = 4.28QTVLKK116 pKa = 10.63QIGDD120 pKa = 3.43QAIADD125 pKa = 4.12GVDD128 pKa = 3.74AIIPIATLAAQVMAVCAEE146 pKa = 4.08DD147 pKa = 3.44TQTPVIYY154 pKa = 10.2AAISDD159 pKa = 4.12PEE161 pKa = 4.08AAEE164 pKa = 4.07VTGIDD169 pKa = 4.25YY170 pKa = 8.61VTGTSDD176 pKa = 4.28ALNTDD181 pKa = 4.87FIIDD185 pKa = 3.72MMLKK189 pKa = 10.22QNPDD193 pKa = 3.22TKK195 pKa = 10.81KK196 pKa = 10.78VGLLYY201 pKa = 10.8SLSEE205 pKa = 4.43PNSATPVAEE214 pKa = 3.67ARR216 pKa = 11.84EE217 pKa = 4.1YY218 pKa = 11.27LDD220 pKa = 3.47SKK222 pKa = 10.62GVGYY226 pKa = 10.85VEE228 pKa = 4.18ATGNTNDD235 pKa = 3.75EE236 pKa = 4.47VIAAASVLVSEE247 pKa = 5.18GVDD250 pKa = 3.37AVFTPTDD257 pKa = 4.1NIVMAAEE264 pKa = 3.9MAIAGTFAEE273 pKa = 4.81AGIPHH278 pKa = 5.71YY279 pKa = 9.7TGADD283 pKa = 3.26SFVRR287 pKa = 11.84NGAFATCGVNYY298 pKa = 9.68TDD300 pKa = 5.79LGTKK304 pKa = 8.71TADD307 pKa = 3.62LAYY310 pKa = 10.36QAITDD315 pKa = 3.86GMGGMEE321 pKa = 5.77DD322 pKa = 4.46YY323 pKa = 11.42YY324 pKa = 11.73KK325 pKa = 9.96MDD327 pKa = 3.34GGIITVNTEE336 pKa = 3.55TAEE339 pKa = 4.16TLKK342 pKa = 10.81ADD344 pKa = 3.72YY345 pKa = 11.71SMFASMGEE353 pKa = 4.03LVEE356 pKa = 4.5VSTTEE361 pKa = 3.84EE362 pKa = 3.8
MM1 pKa = 7.43KK2 pKa = 10.32KK3 pKa = 10.21VLAVTAAAAMGLSLTACSGGAASGSGSDD31 pKa = 3.58SSGASSASGATSVQGASAPSDD52 pKa = 3.49SSSVSGGTAAKK63 pKa = 8.62DD64 pKa = 3.36TYY66 pKa = 10.66KK67 pKa = 10.47IAVVKK72 pKa = 10.88QMDD75 pKa = 4.03HH76 pKa = 6.87ASLDD80 pKa = 4.11EE81 pKa = 4.03IAGAVTAEE89 pKa = 4.11LDD91 pKa = 3.78VIAEE95 pKa = 4.25EE96 pKa = 3.84NHH98 pKa = 4.88ITIEE102 pKa = 4.2YY103 pKa = 9.49EE104 pKa = 4.2VYY106 pKa = 10.46SGQGEE111 pKa = 4.28QTVLKK116 pKa = 10.63QIGDD120 pKa = 3.43QAIADD125 pKa = 4.12GVDD128 pKa = 3.74AIIPIATLAAQVMAVCAEE146 pKa = 4.08DD147 pKa = 3.44TQTPVIYY154 pKa = 10.2AAISDD159 pKa = 4.12PEE161 pKa = 4.08AAEE164 pKa = 4.07VTGIDD169 pKa = 4.25YY170 pKa = 8.61VTGTSDD176 pKa = 4.28ALNTDD181 pKa = 4.87FIIDD185 pKa = 3.72MMLKK189 pKa = 10.22QNPDD193 pKa = 3.22TKK195 pKa = 10.81KK196 pKa = 10.78VGLLYY201 pKa = 10.8SLSEE205 pKa = 4.43PNSATPVAEE214 pKa = 3.67ARR216 pKa = 11.84EE217 pKa = 4.1YY218 pKa = 11.27LDD220 pKa = 3.47SKK222 pKa = 10.62GVGYY226 pKa = 10.85VEE228 pKa = 4.18ATGNTNDD235 pKa = 3.75EE236 pKa = 4.47VIAAASVLVSEE247 pKa = 5.18GVDD250 pKa = 3.37AVFTPTDD257 pKa = 4.1NIVMAAEE264 pKa = 3.9MAIAGTFAEE273 pKa = 4.81AGIPHH278 pKa = 5.71YY279 pKa = 9.7TGADD283 pKa = 3.26SFVRR287 pKa = 11.84NGAFATCGVNYY298 pKa = 9.68TDD300 pKa = 5.79LGTKK304 pKa = 8.71TADD307 pKa = 3.62LAYY310 pKa = 10.36QAITDD315 pKa = 3.86GMGGMEE321 pKa = 5.77DD322 pKa = 4.46YY323 pKa = 11.42YY324 pKa = 11.73KK325 pKa = 9.96MDD327 pKa = 3.34GGIITVNTEE336 pKa = 3.55TAEE339 pKa = 4.16TLKK342 pKa = 10.81ADD344 pKa = 3.72YY345 pKa = 11.71SMFASMGEE353 pKa = 4.03LVEE356 pKa = 4.5VSTTEE361 pKa = 3.84EE362 pKa = 3.8
Molecular weight: 36.95 kDa
Isoelectric point according different methods:
Protein with the highest isoelectric point:
>tr|A0A396QHA3|A0A396QHA3_9FIRM Aminotransferase class III-fold pyridoxal phosphate-dependent enzyme OS=Lachnospiraceae bacterium OF09-33XD OX=2292273 GN=DXA96_09700 PE=3 SV=1
MM1 pKa = 7.67KK2 pKa = 8.72MTFQPKK8 pKa = 8.86KK9 pKa = 8.2RR10 pKa = 11.84SRR12 pKa = 11.84AKK14 pKa = 9.27VHH16 pKa = 5.81GFRR19 pKa = 11.84ARR21 pKa = 11.84MSTKK25 pKa = 10.15GGRR28 pKa = 11.84KK29 pKa = 8.69VLAARR34 pKa = 11.84RR35 pKa = 11.84LKK37 pKa = 10.48GRR39 pKa = 11.84KK40 pKa = 8.27EE41 pKa = 3.72LSAA44 pKa = 4.99
MM1 pKa = 7.67KK2 pKa = 8.72MTFQPKK8 pKa = 8.86KK9 pKa = 8.2RR10 pKa = 11.84SRR12 pKa = 11.84AKK14 pKa = 9.27VHH16 pKa = 5.81GFRR19 pKa = 11.84ARR21 pKa = 11.84MSTKK25 pKa = 10.15GGRR28 pKa = 11.84KK29 pKa = 8.69VLAARR34 pKa = 11.84RR35 pKa = 11.84LKK37 pKa = 10.48GRR39 pKa = 11.84KK40 pKa = 8.27EE41 pKa = 3.72LSAA44 pKa = 4.99
Molecular weight: 5.06 kDa
Isoelectric point according different methods:
Peptides (in silico digests for buttom-up proteomics)
Below you can find in silico digests of the whole proteome with Trypsin, Chymotrypsin, Trypsin+LysC, LysN, ArgC proteases suitable for different mass spec machines.| Try ESI |
 |
|---|
| ChTry ESI |
 |
|---|
| ArgC ESI |
 |
|---|
| LysN ESI |
 |
|---|
| TryLysC ESI |
 |
|---|
| Try MALDI |
 |
|---|
| ChTry MALDI |
 |
|---|
| ArgC MALDI |
 |
|---|
| LysN MALDI |
 |
|---|
| TryLysC MALDI |
 |
|---|
| Try LTQ |
 |
|---|
| ChTry LTQ |
 |
|---|
| ArgC LTQ |
 |
|---|
| LysN LTQ |
 |
|---|
| TryLysC LTQ |
 |
|---|
| Try MSlow |
 |
|---|
| ChTry MSlow |
 |
|---|
| ArgC MSlow |
 |
|---|
| LysN MSlow |
 |
|---|
| TryLysC MSlow |
 |
|---|
| Try MShigh |
 |
|---|
| ChTry MShigh |
 |
|---|
| ArgC MShigh |
 |
|---|
| LysN MShigh |
 |
|---|
| TryLysC MShigh |
 |
|---|
General Statistics
Number of major isoforms |
Number of additional isoforms |
Number of all proteins |
Number of amino acids |
Min. Seq. Length |
Max. Seq. Length |
Avg. Seq. Length |
Avg. Mol. Weight |
|---|---|---|---|---|---|---|---|
0 |
997160 |
20 |
3886 |
293.1 |
32.68 |
Amino acid frequency
Ala |
Cys |
Asp |
Glu |
Phe |
Gly |
His |
Ile |
Lys |
Leu |
|---|---|---|---|---|---|---|---|---|---|
8.086 ± 0.046 | 1.652 ± 0.019 |
5.375 ± 0.031 | 7.662 ± 0.045 |
3.842 ± 0.032 | 7.757 ± 0.04 |
1.729 ± 0.021 | 6.763 ± 0.034 |
5.795 ± 0.032 | 9.237 ± 0.046 |
Met |
Asn |
Gln |
Pro |
Arg |
Ser |
Thr |
Val |
Trp |
Tyr |
|---|---|---|---|---|---|---|---|---|---|
3.072 ± 0.024 | 3.878 ± 0.029 |
3.572 ± 0.026 | 3.45 ± 0.024 |
5.078 ± 0.037 | 5.982 ± 0.035 |
5.248 ± 0.041 | 6.874 ± 0.031 |
0.975 ± 0.014 | 3.975 ± 0.031 |
Most of the basic statistics you can see at this page can be downloaded from this CSV file
Proteome-pI is available under Creative Commons Attribution-NoDerivs license, for more details see here
| Reference: Kozlowski LP. Proteome-pI 2.0: Proteome Isoelectric Point Database Update. Nucleic Acids Res. 2021, doi: 10.1093/nar/gkab944 | Contact: Lukasz P. Kozlowski |
