Halanaerobium praevalens (strain ATCC 33744 / DSM 2228 / GSL)
Taxonomy: cellular organisms; Bacteria; Terrabacteria group; Firmicutes; Clostridia; Halanaerobiales; Halanaerobiaceae; Halanaerobium; Halanaerobium praevalens
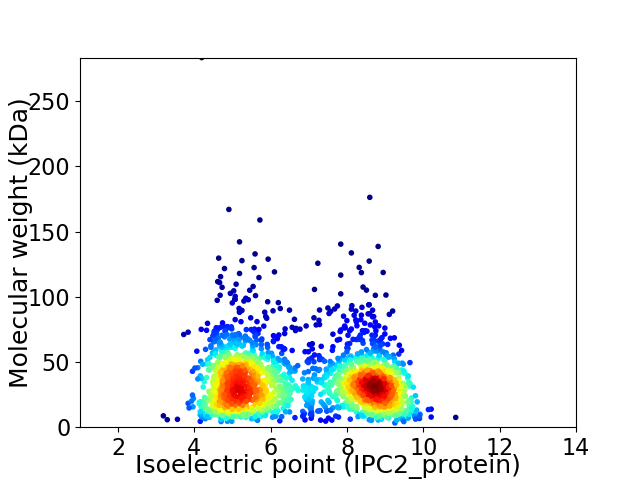
Average proteome isoelectric point is 6.76
Get precalculated fractions of proteins

Virtual 2D-PAGE plot for 2055 proteins (isoelectric point calculated using IPC2_protein)
Get csv file with sequences according to given criteria:
* You can choose from 21 different methods for calculating isoelectric point
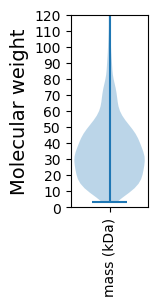
Summary statistics related to proteome-wise predictions


Protein with the lowest isoelectric point:
>tr|E3DQN5|E3DQN5_HALPG Outer membrane efflux protein OS=Halanaerobium praevalens (strain ATCC 33744 / DSM 2228 / GSL) OX=572479 GN=Hprae_1821 PE=3 SV=1
MM1 pKa = 7.46KK2 pKa = 10.54SKK4 pKa = 10.61ILVLFLAAFLVIGLSSASMAQVPGYY29 pKa = 9.77WDD31 pKa = 3.06IKK33 pKa = 10.0GAIDD37 pKa = 3.84FGGEE41 pKa = 3.42IDD43 pKa = 4.39IDD45 pKa = 3.96GASDD49 pKa = 3.51EE50 pKa = 5.29DD51 pKa = 4.04VDD53 pKa = 5.32SGFTLVGEE61 pKa = 4.33YY62 pKa = 10.01KK63 pKa = 10.63VPYY66 pKa = 8.21TSQWTLGAGMRR77 pKa = 11.84YY78 pKa = 9.27QLDD81 pKa = 3.73RR82 pKa = 11.84EE83 pKa = 4.18TDD85 pKa = 3.46DD86 pKa = 3.54TKK88 pKa = 11.56KK89 pKa = 10.79DD90 pKa = 3.55FNFIPFYY97 pKa = 11.37GLAQYY102 pKa = 11.4NMQNSPYY109 pKa = 9.95YY110 pKa = 10.75LLGHH114 pKa = 7.17LGYY117 pKa = 8.55NTFDD121 pKa = 3.21IDD123 pKa = 3.93TYY125 pKa = 10.79SDD127 pKa = 3.54EE128 pKa = 4.63SGGMYY133 pKa = 10.01YY134 pKa = 10.73AVGAGMDD141 pKa = 3.83LASNMSAEE149 pKa = 4.14VMYY152 pKa = 10.86SVNNGEE158 pKa = 4.57AEE160 pKa = 4.55VKK162 pKa = 9.76GTDD165 pKa = 3.44QDD167 pKa = 3.84VEE169 pKa = 4.32YY170 pKa = 11.29SKK172 pKa = 10.72LTVSLGYY179 pKa = 10.31QFF181 pKa = 5.42
MM1 pKa = 7.46KK2 pKa = 10.54SKK4 pKa = 10.61ILVLFLAAFLVIGLSSASMAQVPGYY29 pKa = 9.77WDD31 pKa = 3.06IKK33 pKa = 10.0GAIDD37 pKa = 3.84FGGEE41 pKa = 3.42IDD43 pKa = 4.39IDD45 pKa = 3.96GASDD49 pKa = 3.51EE50 pKa = 5.29DD51 pKa = 4.04VDD53 pKa = 5.32SGFTLVGEE61 pKa = 4.33YY62 pKa = 10.01KK63 pKa = 10.63VPYY66 pKa = 8.21TSQWTLGAGMRR77 pKa = 11.84YY78 pKa = 9.27QLDD81 pKa = 3.73RR82 pKa = 11.84EE83 pKa = 4.18TDD85 pKa = 3.46DD86 pKa = 3.54TKK88 pKa = 11.56KK89 pKa = 10.79DD90 pKa = 3.55FNFIPFYY97 pKa = 11.37GLAQYY102 pKa = 11.4NMQNSPYY109 pKa = 9.95YY110 pKa = 10.75LLGHH114 pKa = 7.17LGYY117 pKa = 8.55NTFDD121 pKa = 3.21IDD123 pKa = 3.93TYY125 pKa = 10.79SDD127 pKa = 3.54EE128 pKa = 4.63SGGMYY133 pKa = 10.01YY134 pKa = 10.73AVGAGMDD141 pKa = 3.83LASNMSAEE149 pKa = 4.14VMYY152 pKa = 10.86SVNNGEE158 pKa = 4.57AEE160 pKa = 4.55VKK162 pKa = 9.76GTDD165 pKa = 3.44QDD167 pKa = 3.84VEE169 pKa = 4.32YY170 pKa = 11.29SKK172 pKa = 10.72LTVSLGYY179 pKa = 10.31QFF181 pKa = 5.42
Molecular weight: 19.96 kDa
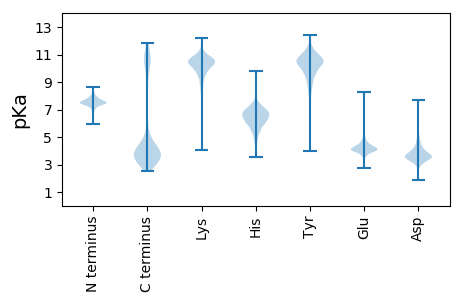
Isoelectric point according different methods:
Protein with the highest isoelectric point:
>tr|E3DLB5|E3DLB5_HALPG Ribosomal protein S12 methylthiotransferase RimO OS=Halanaerobium praevalens (strain ATCC 33744 / DSM 2228 / GSL) OX=572479 GN=rimO PE=3 SV=1
MM1 pKa = 7.48PRR3 pKa = 11.84GRR5 pKa = 11.84NKK7 pKa = 10.31SCHH10 pKa = 5.01FCANEE15 pKa = 3.94NKK17 pKa = 10.51KK18 pKa = 9.71IDD20 pKa = 3.95YY21 pKa = 10.38KK22 pKa = 10.61DD23 pKa = 3.61LRR25 pKa = 11.84TLNRR29 pKa = 11.84YY30 pKa = 7.79LTDD33 pKa = 3.45RR34 pKa = 11.84GKK36 pKa = 10.5IMPRR40 pKa = 11.84RR41 pKa = 11.84VTGNCSKK48 pKa = 10.36HH49 pKa = 5.42QKK51 pKa = 10.45LITKK55 pKa = 9.09AVKK58 pKa = 9.94RR59 pKa = 11.84ARR61 pKa = 11.84SVALLPYY68 pKa = 10.22VKK70 pKa = 10.27EE71 pKa = 4.05
MM1 pKa = 7.48PRR3 pKa = 11.84GRR5 pKa = 11.84NKK7 pKa = 10.31SCHH10 pKa = 5.01FCANEE15 pKa = 3.94NKK17 pKa = 10.51KK18 pKa = 9.71IDD20 pKa = 3.95YY21 pKa = 10.38KK22 pKa = 10.61DD23 pKa = 3.61LRR25 pKa = 11.84TLNRR29 pKa = 11.84YY30 pKa = 7.79LTDD33 pKa = 3.45RR34 pKa = 11.84GKK36 pKa = 10.5IMPRR40 pKa = 11.84RR41 pKa = 11.84VTGNCSKK48 pKa = 10.36HH49 pKa = 5.42QKK51 pKa = 10.45LITKK55 pKa = 9.09AVKK58 pKa = 9.94RR59 pKa = 11.84ARR61 pKa = 11.84SVALLPYY68 pKa = 10.22VKK70 pKa = 10.27EE71 pKa = 4.05
Molecular weight: 8.32 kDa
Isoelectric point according different methods:
Peptides (in silico digests for buttom-up proteomics)
Below you can find in silico digests of the whole proteome with Trypsin, Chymotrypsin, Trypsin+LysC, LysN, ArgC proteases suitable for different mass spec machines.| Try ESI |
 |
|---|
| ChTry ESI |
 |
|---|
| ArgC ESI |
 |
|---|
| LysN ESI |
 |
|---|
| TryLysC ESI |
 |
|---|
| Try MALDI |
 |
|---|
| ChTry MALDI |
 |
|---|
| ArgC MALDI |
 |
|---|
| LysN MALDI |
 |
|---|
| TryLysC MALDI |
 |
|---|
| Try LTQ |
 |
|---|
| ChTry LTQ |
 |
|---|
| ArgC LTQ |
 |
|---|
| LysN LTQ |
 |
|---|
| TryLysC LTQ |
 |
|---|
| Try MSlow |
 |
|---|
| ChTry MSlow |
 |
|---|
| ArgC MSlow |
 |
|---|
| LysN MSlow |
 |
|---|
| TryLysC MSlow |
 |
|---|
| Try MShigh |
 |
|---|
| ChTry MShigh |
 |
|---|
| ArgC MShigh |
 |
|---|
| LysN MShigh |
 |
|---|
| TryLysC MShigh |
 |
|---|
General Statistics
Number of major isoforms |
Number of additional isoforms |
Number of all proteins |
Number of amino acids |
Min. Seq. Length |
Max. Seq. Length |
Avg. Seq. Length |
Avg. Mol. Weight |
|---|---|---|---|---|---|---|---|
0 |
674614 |
30 |
2607 |
328.3 |
36.93 |
Amino acid frequency
Ala |
Cys |
Asp |
Glu |
Phe |
Gly |
His |
Ile |
Lys |
Leu |
|---|---|---|---|---|---|---|---|---|---|
7.581 ± 0.054 | 0.606 ± 0.017 |
5.238 ± 0.044 | 7.776 ± 0.061 |
4.455 ± 0.042 | 6.143 ± 0.057 |
1.388 ± 0.018 | 8.951 ± 0.049 |
9.126 ± 0.071 | 10.332 ± 0.06 |
Met |
Asn |
Gln |
Pro |
Arg |
Ser |
Thr |
Val |
Trp |
Tyr |
|---|---|---|---|---|---|---|---|---|---|
2.231 ± 0.027 | 5.679 ± 0.055 |
2.998 ± 0.03 | 3.575 ± 0.038 |
3.42 ± 0.035 | 5.883 ± 0.04 |
4.432 ± 0.034 | 5.845 ± 0.049 |
0.68 ± 0.017 | 3.659 ± 0.038 |
Most of the basic statistics you can see at this page can be downloaded from this CSV file
Proteome-pI is available under Creative Commons Attribution-NoDerivs license, for more details see here
| Reference: Kozlowski LP. Proteome-pI 2.0: Proteome Isoelectric Point Database Update. Nucleic Acids Res. 2021, doi: 10.1093/nar/gkab944 | Contact: Lukasz P. Kozlowski |
