Thalassolituus oleivorans MIL-1
Taxonomy: cellular organisms; Bacteria; Proteobacteria; Gammaproteobacteria; Oceanospirillales; Oceanospirillaceae; Thalassolituus; Thalassolituus oleivorans
Average proteome isoelectric point is 6.0
Get precalculated fractions of proteins

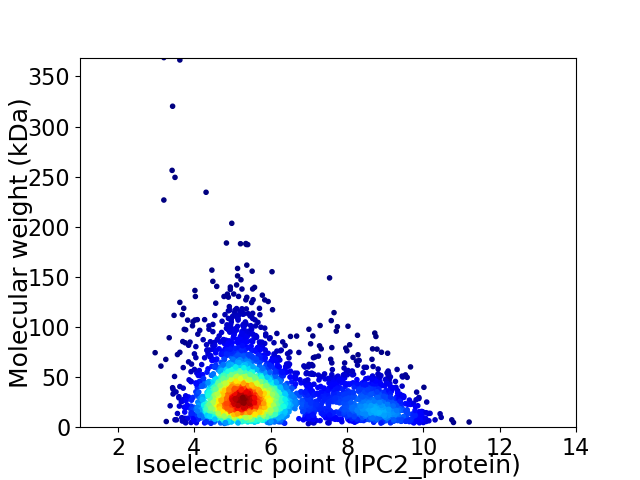
Virtual 2D-PAGE plot for 3634 proteins (isoelectric point calculated using IPC2_protein)
Get csv file with sequences according to given criteria:
* You can choose from 21 different methods for calculating isoelectric point
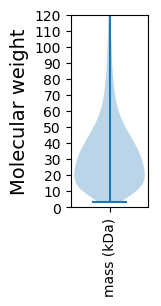
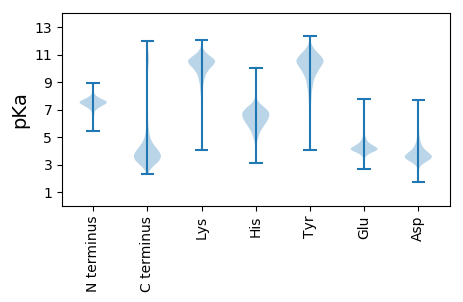
Summary statistics related to proteome-wise predictions


Protein with the lowest isoelectric point:
>tr|M5DST1|M5DST1_9GAMM Peptidoglycan-associated protein OS=Thalassolituus oleivorans MIL-1 OX=1298593 GN=pal PE=3 SV=1
MM1 pKa = 7.66KK2 pKa = 8.89KK3 pKa = 7.91TAIAAFIVALAPVASHH19 pKa = 7.15ADD21 pKa = 3.5LLFTVGAKK29 pKa = 10.34ASVWNAEE36 pKa = 3.93PTGQIDD42 pKa = 4.34DD43 pKa = 5.43DD44 pKa = 4.45ISVDD48 pKa = 3.44SSNNGLGLDD57 pKa = 4.3SEE59 pKa = 5.2NGTQLTVFFEE69 pKa = 4.87HH70 pKa = 6.98PVPMLPNIKK79 pKa = 10.08LKK81 pKa = 8.96QTSLDD86 pKa = 3.54LSGDD90 pKa = 3.47GTLALSTSFNGQAFAGPVTSDD111 pKa = 3.82LDD113 pKa = 3.94LSHH116 pKa = 7.35TDD118 pKa = 2.99VTLYY122 pKa = 10.04WGLPLPLPYY131 pKa = 10.49VDD133 pKa = 4.84INFGLTGRR141 pKa = 11.84MFDD144 pKa = 4.12GYY146 pKa = 11.48AEE148 pKa = 4.16VSNTLSGTEE157 pKa = 4.1RR158 pKa = 11.84VDD160 pKa = 4.22LDD162 pKa = 3.35ATVPMVYY169 pKa = 10.22GAVKK173 pKa = 10.06VDD175 pKa = 3.63TPFGVYY181 pKa = 10.23AQVDD185 pKa = 3.85VNYY188 pKa = 9.91IGYY191 pKa = 9.78SGNTLSDD198 pKa = 2.81ISYY201 pKa = 10.9GLGYY205 pKa = 10.33DD206 pKa = 3.85LPVPIADD213 pKa = 3.49IGLEE217 pKa = 3.6AGYY220 pKa = 10.36RR221 pKa = 11.84SLSMKK226 pKa = 9.83TDD228 pKa = 3.31EE229 pKa = 5.34DD230 pKa = 3.81LTDD233 pKa = 3.17IATDD237 pKa = 3.34VDD239 pKa = 4.2VSGLYY244 pKa = 10.29YY245 pKa = 10.42GASVSIGFF253 pKa = 4.13
MM1 pKa = 7.66KK2 pKa = 8.89KK3 pKa = 7.91TAIAAFIVALAPVASHH19 pKa = 7.15ADD21 pKa = 3.5LLFTVGAKK29 pKa = 10.34ASVWNAEE36 pKa = 3.93PTGQIDD42 pKa = 4.34DD43 pKa = 5.43DD44 pKa = 4.45ISVDD48 pKa = 3.44SSNNGLGLDD57 pKa = 4.3SEE59 pKa = 5.2NGTQLTVFFEE69 pKa = 4.87HH70 pKa = 6.98PVPMLPNIKK79 pKa = 10.08LKK81 pKa = 8.96QTSLDD86 pKa = 3.54LSGDD90 pKa = 3.47GTLALSTSFNGQAFAGPVTSDD111 pKa = 3.82LDD113 pKa = 3.94LSHH116 pKa = 7.35TDD118 pKa = 2.99VTLYY122 pKa = 10.04WGLPLPLPYY131 pKa = 10.49VDD133 pKa = 4.84INFGLTGRR141 pKa = 11.84MFDD144 pKa = 4.12GYY146 pKa = 11.48AEE148 pKa = 4.16VSNTLSGTEE157 pKa = 4.1RR158 pKa = 11.84VDD160 pKa = 4.22LDD162 pKa = 3.35ATVPMVYY169 pKa = 10.22GAVKK173 pKa = 10.06VDD175 pKa = 3.63TPFGVYY181 pKa = 10.23AQVDD185 pKa = 3.85VNYY188 pKa = 9.91IGYY191 pKa = 9.78SGNTLSDD198 pKa = 2.81ISYY201 pKa = 10.9GLGYY205 pKa = 10.33DD206 pKa = 3.85LPVPIADD213 pKa = 3.49IGLEE217 pKa = 3.6AGYY220 pKa = 10.36RR221 pKa = 11.84SLSMKK226 pKa = 9.83TDD228 pKa = 3.31EE229 pKa = 5.34DD230 pKa = 3.81LTDD233 pKa = 3.17IATDD237 pKa = 3.34VDD239 pKa = 4.2VSGLYY244 pKa = 10.29YY245 pKa = 10.42GASVSIGFF253 pKa = 4.13
Molecular weight: 26.74 kDa
Isoelectric point according different methods:
Protein with the highest isoelectric point:
>tr|M5DYQ5|M5DYQ5_9GAMM RadC gene product OS=Thalassolituus oleivorans MIL-1 OX=1298593 GN=TOL_0211 PE=3 SV=1
MM1 pKa = 7.45KK2 pKa = 9.51RR3 pKa = 11.84TFQPSVLKK11 pKa = 10.49RR12 pKa = 11.84KK13 pKa = 7.97RR14 pKa = 11.84THH16 pKa = 5.89GFRR19 pKa = 11.84ARR21 pKa = 11.84MATKK25 pKa = 10.35NGRR28 pKa = 11.84LVLARR33 pKa = 11.84RR34 pKa = 11.84RR35 pKa = 11.84AKK37 pKa = 10.27GRR39 pKa = 11.84HH40 pKa = 5.41SLTAA44 pKa = 3.92
MM1 pKa = 7.45KK2 pKa = 9.51RR3 pKa = 11.84TFQPSVLKK11 pKa = 10.49RR12 pKa = 11.84KK13 pKa = 7.97RR14 pKa = 11.84THH16 pKa = 5.89GFRR19 pKa = 11.84ARR21 pKa = 11.84MATKK25 pKa = 10.35NGRR28 pKa = 11.84LVLARR33 pKa = 11.84RR34 pKa = 11.84RR35 pKa = 11.84AKK37 pKa = 10.27GRR39 pKa = 11.84HH40 pKa = 5.41SLTAA44 pKa = 3.92
Molecular weight: 5.15 kDa
Isoelectric point according different methods:
Peptides (in silico digests for buttom-up proteomics)
Below you can find in silico digests of the whole proteome with Trypsin, Chymotrypsin, Trypsin+LysC, LysN, ArgC proteases suitable for different mass spec machines.| Try ESI |
 |
|---|
| ChTry ESI |
 |
|---|
| ArgC ESI |
 |
|---|
| LysN ESI |
 |
|---|
| TryLysC ESI |
 |
|---|
| Try MALDI |
 |
|---|
| ChTry MALDI |
 |
|---|
| ArgC MALDI |
 |
|---|
| LysN MALDI |
 |
|---|
| TryLysC MALDI |
 |
|---|
| Try LTQ |
 |
|---|
| ChTry LTQ |
 |
|---|
| ArgC LTQ |
 |
|---|
| LysN LTQ |
 |
|---|
| TryLysC LTQ |
 |
|---|
| Try MSlow |
 |
|---|
| ChTry MSlow |
 |
|---|
| ArgC MSlow |
 |
|---|
| LysN MSlow |
 |
|---|
| TryLysC MSlow |
 |
|---|
| Try MShigh |
 |
|---|
| ChTry MShigh |
 |
|---|
| ArgC MShigh |
 |
|---|
| LysN MShigh |
 |
|---|
| TryLysC MShigh |
 |
|---|
General Statistics
Number of major isoforms |
Number of additional isoforms |
Number of all proteins |
Number of amino acids |
Min. Seq. Length |
Max. Seq. Length |
Avg. Seq. Length |
Avg. Mol. Weight |
|---|---|---|---|---|---|---|---|
0 |
1170392 |
31 |
3596 |
322.1 |
35.64 |
Amino acid frequency
Ala |
Cys |
Asp |
Glu |
Phe |
Gly |
His |
Ile |
Lys |
Leu |
|---|---|---|---|---|---|---|---|---|---|
9.504 ± 0.051 | 0.957 ± 0.013 |
6.023 ± 0.04 | 6.143 ± 0.038 |
3.803 ± 0.028 | 7.011 ± 0.047 |
2.202 ± 0.027 | 6.001 ± 0.032 |
4.373 ± 0.035 | 10.438 ± 0.059 |
Met |
Asn |
Gln |
Pro |
Arg |
Ser |
Thr |
Val |
Trp |
Tyr |
|---|---|---|---|---|---|---|---|---|---|
2.599 ± 0.023 | 4.036 ± 0.035 |
4.111 ± 0.029 | 4.321 ± 0.034 |
5.325 ± 0.041 | 6.471 ± 0.043 |
5.515 ± 0.046 | 6.91 ± 0.038 |
1.346 ± 0.017 | 2.911 ± 0.024 |
Most of the basic statistics you can see at this page can be downloaded from this CSV file
Proteome-pI is available under Creative Commons Attribution-NoDerivs license, for more details see here
| Reference: Kozlowski LP. Proteome-pI 2.0: Proteome Isoelectric Point Database Update. Nucleic Acids Res. 2021, doi: 10.1093/nar/gkab944 | Contact: Lukasz P. Kozlowski |
