Erythrobacter litoralis
Taxonomy: cellular organisms; Bacteria; Proteobacteria; Alphaproteobacteria; Sphingomonadales; Erythroba
Average proteome isoelectric point is 5.91
Get precalculated fractions of proteins

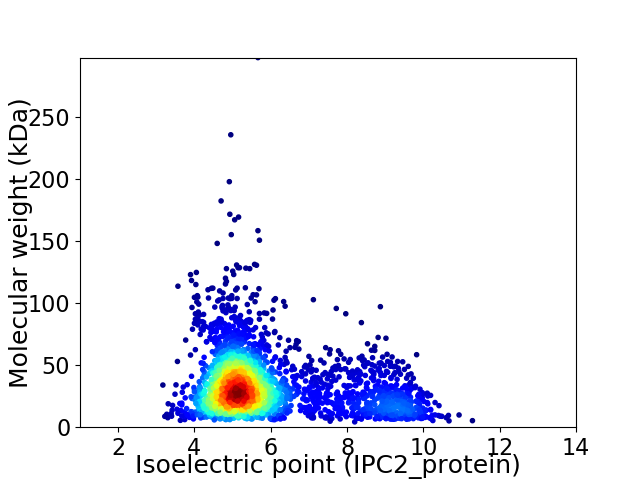
Virtual 2D-PAGE plot for 2981 proteins (isoelectric point calculated using IPC2_protein)
Get csv file with sequences according to given criteria:
* You can choose from 21 different methods for calculating isoelectric point
Summary statistics related to proteome-wise predictions


Protein with the lowest isoelectric point:
>tr|A0A074MEZ3|A0A074MEZ3_9SPHN Cystathionine beta-lyase OS=Erythrobacter litoralis OX=39960 GN=EH32_12045 PE=3 SV=1
MM1 pKa = 7.52ALAAAPAFAAPAGEE15 pKa = 4.32EE16 pKa = 4.36LPHH19 pKa = 6.68EE20 pKa = 5.06GPDD23 pKa = 3.51AQDD26 pKa = 3.13PVIPIKK32 pKa = 10.62ARR34 pKa = 11.84SGIGEE39 pKa = 3.86GRR41 pKa = 11.84EE42 pKa = 4.21ANNTASAISGQGFTITANATLASEE66 pKa = 4.18YY67 pKa = 10.36RR68 pKa = 11.84FRR70 pKa = 11.84GVDD73 pKa = 3.55LSGGDD78 pKa = 3.52PTVQGGIDD86 pKa = 3.87LFHH89 pKa = 7.31DD90 pKa = 3.34TGFYY94 pKa = 10.67AGTFASTLDD103 pKa = 4.5DD104 pKa = 3.58EE105 pKa = 4.89TTGYY109 pKa = 10.93GGLEE113 pKa = 3.93LDD115 pKa = 6.25FYY117 pKa = 11.28AGWSGDD123 pKa = 3.58VAEE126 pKa = 5.1GLSANLGVIAYY137 pKa = 6.92TFPDD141 pKa = 3.69APEE144 pKa = 4.87GDD146 pKa = 3.81FDD148 pKa = 4.26YY149 pKa = 11.62LEE151 pKa = 5.25LYY153 pKa = 10.62GSVGFTLGPAQATVGAAWDD172 pKa = 3.62VGEE175 pKa = 5.16DD176 pKa = 3.54GLRR179 pKa = 11.84FGGLRR184 pKa = 11.84RR185 pKa = 11.84DD186 pKa = 3.47NLYY189 pKa = 11.11VYY191 pKa = 9.72TDD193 pKa = 3.86LSAGVPGTPVTVNAHH208 pKa = 6.45LGYY211 pKa = 9.31TDD213 pKa = 3.74GAIDD217 pKa = 3.64FAGEE221 pKa = 4.27SVSFDD226 pKa = 3.05WSLGADD232 pKa = 3.2WAIRR236 pKa = 11.84DD237 pKa = 3.92TPLVLGVAYY246 pKa = 10.54VDD248 pKa = 3.96AADD251 pKa = 4.92DD252 pKa = 3.86VAPPGAFNPTSGTILGTLTAYY273 pKa = 9.83FF274 pKa = 4.01
MM1 pKa = 7.52ALAAAPAFAAPAGEE15 pKa = 4.32EE16 pKa = 4.36LPHH19 pKa = 6.68EE20 pKa = 5.06GPDD23 pKa = 3.51AQDD26 pKa = 3.13PVIPIKK32 pKa = 10.62ARR34 pKa = 11.84SGIGEE39 pKa = 3.86GRR41 pKa = 11.84EE42 pKa = 4.21ANNTASAISGQGFTITANATLASEE66 pKa = 4.18YY67 pKa = 10.36RR68 pKa = 11.84FRR70 pKa = 11.84GVDD73 pKa = 3.55LSGGDD78 pKa = 3.52PTVQGGIDD86 pKa = 3.87LFHH89 pKa = 7.31DD90 pKa = 3.34TGFYY94 pKa = 10.67AGTFASTLDD103 pKa = 4.5DD104 pKa = 3.58EE105 pKa = 4.89TTGYY109 pKa = 10.93GGLEE113 pKa = 3.93LDD115 pKa = 6.25FYY117 pKa = 11.28AGWSGDD123 pKa = 3.58VAEE126 pKa = 5.1GLSANLGVIAYY137 pKa = 6.92TFPDD141 pKa = 3.69APEE144 pKa = 4.87GDD146 pKa = 3.81FDD148 pKa = 4.26YY149 pKa = 11.62LEE151 pKa = 5.25LYY153 pKa = 10.62GSVGFTLGPAQATVGAAWDD172 pKa = 3.62VGEE175 pKa = 5.16DD176 pKa = 3.54GLRR179 pKa = 11.84FGGLRR184 pKa = 11.84RR185 pKa = 11.84DD186 pKa = 3.47NLYY189 pKa = 11.11VYY191 pKa = 9.72TDD193 pKa = 3.86LSAGVPGTPVTVNAHH208 pKa = 6.45LGYY211 pKa = 9.31TDD213 pKa = 3.74GAIDD217 pKa = 3.64FAGEE221 pKa = 4.27SVSFDD226 pKa = 3.05WSLGADD232 pKa = 3.2WAIRR236 pKa = 11.84DD237 pKa = 3.92TPLVLGVAYY246 pKa = 10.54VDD248 pKa = 3.96AADD251 pKa = 4.92DD252 pKa = 3.86VAPPGAFNPTSGTILGTLTAYY273 pKa = 9.83FF274 pKa = 4.01
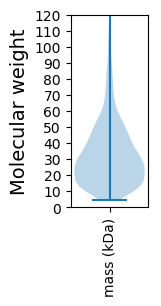
Molecular weight: 28.19 kDa
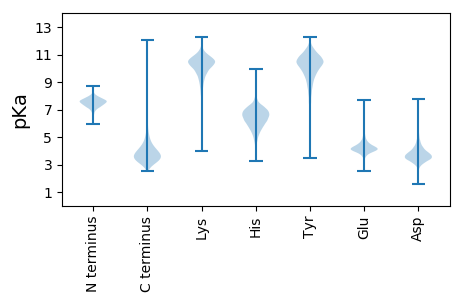
Isoelectric point according different methods:
Protein with the highest isoelectric point:
>tr|A0A074MC34|A0A074MC34_9SPHN Rieske domain-containing protein OS=Erythrobacter litoralis OX=39960 GN=EH32_01055 PE=4 SV=1
MM1 pKa = 7.45KK2 pKa = 9.61RR3 pKa = 11.84TFQPSNLVRR12 pKa = 11.84KK13 pKa = 9.24RR14 pKa = 11.84RR15 pKa = 11.84HH16 pKa = 4.93GFFARR21 pKa = 11.84KK22 pKa = 7.42ATPGGRR28 pKa = 11.84KK29 pKa = 8.05VLRR32 pKa = 11.84LRR34 pKa = 11.84RR35 pKa = 11.84RR36 pKa = 11.84RR37 pKa = 11.84GRR39 pKa = 11.84KK40 pKa = 9.04KK41 pKa = 10.54LSAA44 pKa = 4.03
MM1 pKa = 7.45KK2 pKa = 9.61RR3 pKa = 11.84TFQPSNLVRR12 pKa = 11.84KK13 pKa = 9.24RR14 pKa = 11.84RR15 pKa = 11.84HH16 pKa = 4.93GFFARR21 pKa = 11.84KK22 pKa = 7.42ATPGGRR28 pKa = 11.84KK29 pKa = 8.05VLRR32 pKa = 11.84LRR34 pKa = 11.84RR35 pKa = 11.84RR36 pKa = 11.84RR37 pKa = 11.84GRR39 pKa = 11.84KK40 pKa = 9.04KK41 pKa = 10.54LSAA44 pKa = 4.03
Molecular weight: 5.28 kDa
Isoelectric point according different methods:
Peptides (in silico digests for buttom-up proteomics)
Below you can find in silico digests of the whole proteome with Trypsin, Chymotrypsin, Trypsin+LysC, LysN, ArgC proteases suitable for different mass spec machines.| Try ESI |
 |
|---|
| ChTry ESI |
 |
|---|
| ArgC ESI |
 |
|---|
| LysN ESI |
 |
|---|
| TryLysC ESI |
 |
|---|
| Try MALDI |
 |
|---|
| ChTry MALDI |
 |
|---|
| ArgC MALDI |
 |
|---|
| LysN MALDI |
 |
|---|
| TryLysC MALDI |
 |
|---|
| Try LTQ |
 |
|---|
| ChTry LTQ |
 |
|---|
| ArgC LTQ |
 |
|---|
| LysN LTQ |
 |
|---|
| TryLysC LTQ |
 |
|---|
| Try MSlow |
 |
|---|
| ChTry MSlow |
 |
|---|
| ArgC MSlow |
 |
|---|
| LysN MSlow |
 |
|---|
| TryLysC MSlow |
 |
|---|
| Try MShigh |
 |
|---|
| ChTry MShigh |
 |
|---|
| ArgC MShigh |
 |
|---|
| LysN MShigh |
 |
|---|
| TryLysC MShigh |
 |
|---|
General Statistics
Number of major isoforms |
Number of additional isoforms |
Number of all proteins |
Number of amino acids |
Min. Seq. Length |
Max. Seq. Length |
Avg. Seq. Length |
Avg. Mol. Weight |
|---|---|---|---|---|---|---|---|
0 |
948914 |
41 |
2739 |
318.3 |
34.48 |
Amino acid frequency
Ala |
Cys |
Asp |
Glu |
Phe |
Gly |
His |
Ile |
Lys |
Leu |
|---|---|---|---|---|---|---|---|---|---|
13.05 ± 0.066 | 0.819 ± 0.013 |
6.074 ± 0.039 | 6.917 ± 0.042 |
3.7 ± 0.032 | 9.061 ± 0.038 |
1.902 ± 0.024 | 4.927 ± 0.033 |
2.884 ± 0.039 | 9.72 ± 0.049 |
Met |
Asn |
Gln |
Pro |
Arg |
Ser |
Thr |
Val |
Trp |
Tyr |
|---|---|---|---|---|---|---|---|---|---|
2.464 ± 0.025 | 2.441 ± 0.03 |
5.269 ± 0.031 | 2.841 ± 0.023 |
7.408 ± 0.05 | 5.104 ± 0.03 |
4.952 ± 0.033 | 6.964 ± 0.036 |
1.384 ± 0.02 | 2.119 ± 0.021 |
Most of the basic statistics you can see at this page can be downloaded from this CSV file
Proteome-pI is available under Creative Commons Attribution-NoDerivs license, for more details see here
| Reference: Kozlowski LP. Proteome-pI 2.0: Proteome Isoelectric Point Database Update. Nucleic Acids Res. 2021, doi: 10.1093/nar/gkab944 | Contact: Lukasz P. Kozlowski |
