Rabbit fibroma virus (strain Kasza) (RFV) (Shope fibroma virus (strain Kasza))
Taxonomy: Viruses; Varidnaviria; Bamfordvirae; Nucleocytoviricota; Pokkesviricetes; Chitovirales; Poxviridae; Chordopoxvirinae; Leporipoxvirus; Rabbit fibroma virus
Average proteome isoelectric point is 6.92
Get precalculated fractions of proteins
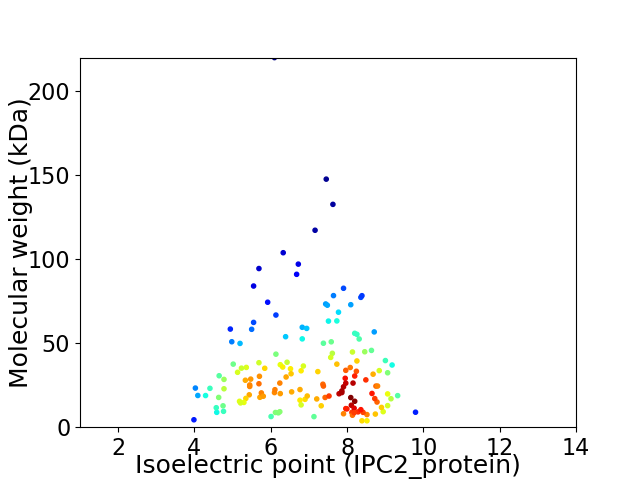
Virtual 2D-PAGE plot for 153 proteins (isoelectric point calculated using IPC2_protein)
Get csv file with sequences according to given criteria:
* You can choose from 21 different methods for calculating isoelectric point
Summary statistics related to proteome-wise predictions
Protein with the lowest isoelectric point:
>sp|Q9Q909|VH21_RFVKA Probable host range protein 2-1 OS=Rabbit fibroma virus (strain Kasza) OX=10272 GN=s062R PE=3 SV=1
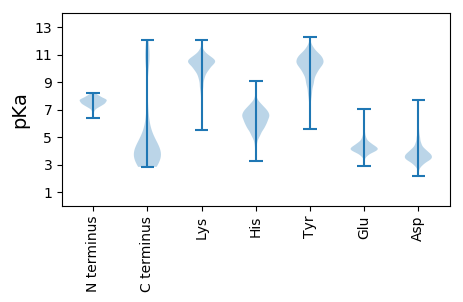
MM1 pKa = 7.69GITHH5 pKa = 7.08EE6 pKa = 4.01FHH8 pKa = 7.08IFLVDD13 pKa = 3.56EE14 pKa = 4.35NVSLKK19 pKa = 10.63SVSLLKK25 pKa = 10.63GDD27 pKa = 4.18SYY29 pKa = 11.86GCNIHH34 pKa = 6.95LKK36 pKa = 10.47NSEE39 pKa = 4.07CKK41 pKa = 10.2YY42 pKa = 9.01ITFILVLEE50 pKa = 4.69PDD52 pKa = 3.01WSEE55 pKa = 3.63IAEE58 pKa = 4.28AKK60 pKa = 9.8PIRR63 pKa = 11.84IRR65 pKa = 11.84LNGKK69 pKa = 8.97KK70 pKa = 8.93MRR72 pKa = 11.84TQLLTKK78 pKa = 9.19TLMSIIYY85 pKa = 9.36KK86 pKa = 9.91AVIYY90 pKa = 10.68VEE92 pKa = 4.7EE93 pKa = 4.06NALVQFYY100 pKa = 11.04SDD102 pKa = 3.44TDD104 pKa = 3.35RR105 pKa = 11.84LYY107 pKa = 10.44TDD109 pKa = 4.16MYY111 pKa = 8.93PTFLIDD117 pKa = 3.24MDD119 pKa = 3.75KK120 pKa = 10.39QHH122 pKa = 6.46YY123 pKa = 9.71HH124 pKa = 6.78ILDD127 pKa = 3.3NGYY130 pKa = 7.66TYY132 pKa = 10.4TYY134 pKa = 8.91IDD136 pKa = 4.05SFISEE141 pKa = 4.47CDD143 pKa = 2.99KK144 pKa = 10.97QRR146 pKa = 11.84YY147 pKa = 5.76LTSDD151 pKa = 2.65IGEE154 pKa = 4.32NGYY157 pKa = 10.6EE158 pKa = 4.09DD159 pKa = 3.63STEE162 pKa = 4.13EE163 pKa = 4.1EE164 pKa = 4.58DD165 pKa = 5.12NEE167 pKa = 4.07EE168 pKa = 4.28DD169 pKa = 3.52TDD171 pKa = 5.18GVCLYY176 pKa = 10.38CLEE179 pKa = 4.41EE180 pKa = 4.27EE181 pKa = 4.36EE182 pKa = 5.74EE183 pKa = 4.09EE184 pKa = 6.06DD185 pKa = 3.72EE186 pKa = 6.68DD187 pKa = 4.46EE188 pKa = 6.72DD189 pKa = 4.33EE190 pKa = 6.65DD191 pKa = 4.16EE192 pKa = 6.47DD193 pKa = 4.76EE194 pKa = 5.68DD195 pKa = 4.77EE196 pKa = 4.78EE197 pKa = 4.47EE198 pKa = 4.09
MM1 pKa = 7.69GITHH5 pKa = 7.08EE6 pKa = 4.01FHH8 pKa = 7.08IFLVDD13 pKa = 3.56EE14 pKa = 4.35NVSLKK19 pKa = 10.63SVSLLKK25 pKa = 10.63GDD27 pKa = 4.18SYY29 pKa = 11.86GCNIHH34 pKa = 6.95LKK36 pKa = 10.47NSEE39 pKa = 4.07CKK41 pKa = 10.2YY42 pKa = 9.01ITFILVLEE50 pKa = 4.69PDD52 pKa = 3.01WSEE55 pKa = 3.63IAEE58 pKa = 4.28AKK60 pKa = 9.8PIRR63 pKa = 11.84IRR65 pKa = 11.84LNGKK69 pKa = 8.97KK70 pKa = 8.93MRR72 pKa = 11.84TQLLTKK78 pKa = 9.19TLMSIIYY85 pKa = 9.36KK86 pKa = 9.91AVIYY90 pKa = 10.68VEE92 pKa = 4.7EE93 pKa = 4.06NALVQFYY100 pKa = 11.04SDD102 pKa = 3.44TDD104 pKa = 3.35RR105 pKa = 11.84LYY107 pKa = 10.44TDD109 pKa = 4.16MYY111 pKa = 8.93PTFLIDD117 pKa = 3.24MDD119 pKa = 3.75KK120 pKa = 10.39QHH122 pKa = 6.46YY123 pKa = 9.71HH124 pKa = 6.78ILDD127 pKa = 3.3NGYY130 pKa = 7.66TYY132 pKa = 10.4TYY134 pKa = 8.91IDD136 pKa = 4.05SFISEE141 pKa = 4.47CDD143 pKa = 2.99KK144 pKa = 10.97QRR146 pKa = 11.84YY147 pKa = 5.76LTSDD151 pKa = 2.65IGEE154 pKa = 4.32NGYY157 pKa = 10.6EE158 pKa = 4.09DD159 pKa = 3.63STEE162 pKa = 4.13EE163 pKa = 4.1EE164 pKa = 4.58DD165 pKa = 5.12NEE167 pKa = 4.07EE168 pKa = 4.28DD169 pKa = 3.52TDD171 pKa = 5.18GVCLYY176 pKa = 10.38CLEE179 pKa = 4.41EE180 pKa = 4.27EE181 pKa = 4.36EE182 pKa = 5.74EE183 pKa = 4.09EE184 pKa = 6.06DD185 pKa = 3.72EE186 pKa = 6.68DD187 pKa = 4.46EE188 pKa = 6.72DD189 pKa = 4.33EE190 pKa = 6.65DD191 pKa = 4.16EE192 pKa = 6.47DD193 pKa = 4.76EE194 pKa = 5.68DD195 pKa = 4.77EE196 pKa = 4.78EE197 pKa = 4.47EE198 pKa = 4.09
Molecular weight: 23.28 kDa
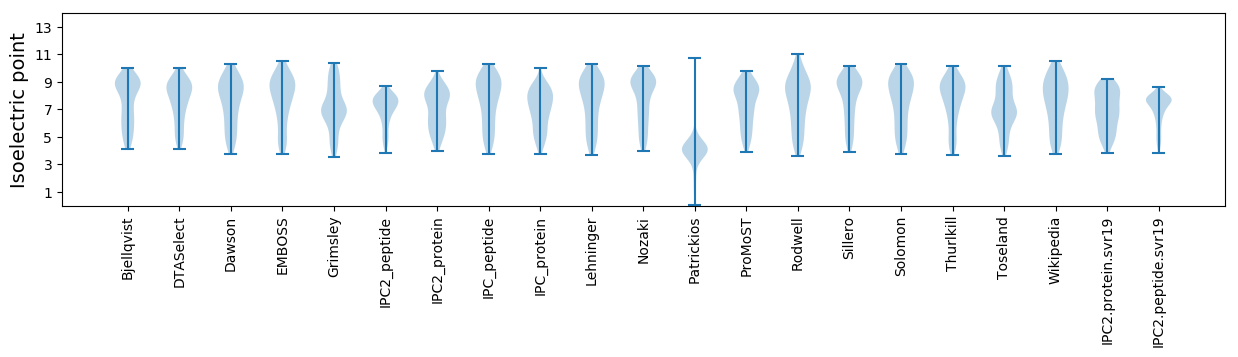
Isoelectric point according different methods:
Protein with the highest isoelectric point:
>tr|Q9Q932|Q9Q932_RFVKA Gp039L OS=Rabbit fibroma virus (strain Kasza) OX=10272 GN=s039L PE=3 SV=1
MM1 pKa = 7.7ALTAKK6 pKa = 10.14EE7 pKa = 4.27VISFIWMTLLFVVMLLAGSALLFKK31 pKa = 10.17TYY33 pKa = 10.7APHH36 pKa = 6.05KK37 pKa = 10.03VVMTRR42 pKa = 11.84SAAFMRR48 pKa = 11.84VVNYY52 pKa = 10.0FEE54 pKa = 4.91LVAILVFIPGTVSLYY69 pKa = 8.71WSYY72 pKa = 11.71VKK74 pKa = 10.29SLRR77 pKa = 11.84FF78 pKa = 3.29
MM1 pKa = 7.7ALTAKK6 pKa = 10.14EE7 pKa = 4.27VISFIWMTLLFVVMLLAGSALLFKK31 pKa = 10.17TYY33 pKa = 10.7APHH36 pKa = 6.05KK37 pKa = 10.03VVMTRR42 pKa = 11.84SAAFMRR48 pKa = 11.84VVNYY52 pKa = 10.0FEE54 pKa = 4.91LVAILVFIPGTVSLYY69 pKa = 8.71WSYY72 pKa = 11.71VKK74 pKa = 10.29SLRR77 pKa = 11.84FF78 pKa = 3.29
Molecular weight: 8.91 kDa
Isoelectric point according different methods:
Peptides (in silico digests for buttom-up proteomics)
Below you can find in silico digests of the whole proteome with Trypsin, Chymotrypsin, Trypsin+LysC, LysN, ArgC proteases suitable for different mass spec machines.| Try ESI |
 |
|---|
| ChTry ESI |
|
|---|
| ArgC ESI |
|
|---|
| LysN ESI |
|
|---|
| TryLysC ESI |
|
|---|
| Try MALDI |
|
|---|
| ChTry MALDI |
|
|---|
| ArgC MALDI |
|
|---|
| LysN MALDI |
|
|---|
| TryLysC MALDI |
|
|---|
| Try LTQ |
|
|---|
| ChTry LTQ |
|
|---|
| ArgC LTQ |
|
|---|
| LysN LTQ |
|
|---|
| TryLysC LTQ |
|
|---|
| Try MSlow |
|
|---|
| ChTry MSlow |
|
|---|
| ArgC MSlow |
|
|---|
| LysN MSlow |
|
|---|
| TryLysC MSlow |
|
|---|
| Try MShigh |
|
|---|
| ChTry MShigh |
|
|---|
| ArgC MShigh |
|
|---|
| LysN MShigh |
|
|---|
| TryLysC MShigh |
|
|---|
General Statistics
Number of major isoforms |
Number of additional isoforms |
Number of all proteins |
Number of amino acids |
Min. Seq. Length |
Max. Seq. Length |
Avg. Seq. Length |
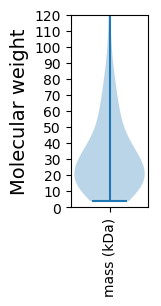
Avg. Mol. Weight |
|---|---|---|---|---|---|---|---|
0 |
46875 |
32 |
1939 |
306.4 |
35.28 |
Amino acid frequency
Ala |
Cys |
Asp |
Glu |
Phe |
Gly |
His |
Ile |
Lys |
Leu |
|---|---|---|---|---|---|---|---|---|---|
3.78 ± 0.116 | 2.17 ± 0.1 |
6.069 ± 0.131 | 5.547 ± 0.12 |
4.813 ± 0.16 | 4.049 ± 0.129 |
2.283 ± 0.079 | 8.299 ± 0.169 |
7.627 ± 0.171 | 9.154 ± 0.164 |
Met |
Asn |
Gln |
Pro |
Arg |
Ser |
Thr |
Val |
Trp |
Tyr |
|---|---|---|---|---|---|---|---|---|---|
2.445 ± 0.078 | 6.114 ± 0.141 |
3.413 ± 0.111 | 2.236 ± 0.078 |
4.365 ± 0.13 | 7.194 ± 0.144 |
6.769 ± 0.143 | 7.479 ± 0.165 |
0.747 ± 0.063 | 5.449 ± 0.124 |
Most of the basic statistics you can see at this page can be downloaded from this CSV file
See this proteome in:

Proteome-pI is available under Creative Commons Attribution-NoDerivs license, for more details see here
| Reference: Kozlowski LP. Proteome-pI 2.0: Proteome Isoelectric Point Database Update. Nucleic Acids Res. 2021, doi: 10.1093/nar/gkab944 | Contact: Lukasz P. Kozlowski |