Nocardia pseudobrasiliensis
Taxonomy: cellular organisms; Bacteria; Terrabacteria group; Actinobacteria; Actinomycetia; Corynebacteriales; Nocardiaceae;
Average proteome isoelectric point is 6.22
Get precalculated fractions of proteins

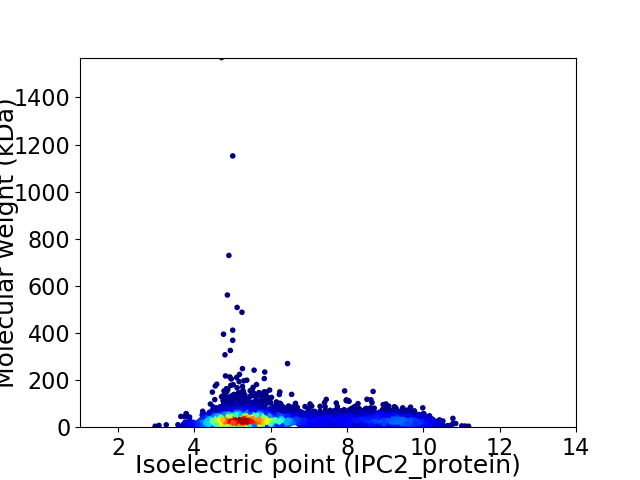
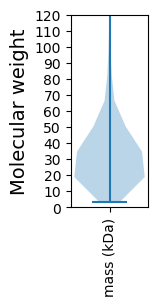
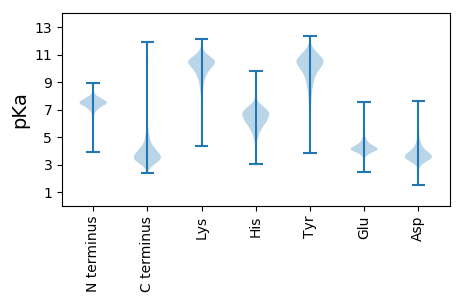
Virtual 2D-PAGE plot for 7943 proteins (isoelectric point calculated using IPC2_protein)
Get csv file with sequences according to given criteria:
* You can choose from 21 different methods for calculating isoelectric point
Summary statistics related to proteome-wise predictions


Protein with the lowest isoelectric point:
>tr|A0A370HXT5|A0A370HXT5_9NOCA Bacterial proteasome activator OS=Nocardia pseudobrasiliensis OX=45979 GN=DFR76_113246 PE=3 SV=1
MM1 pKa = 7.47SPNAILEE8 pKa = 4.84FILSLLRR15 pKa = 11.84DD16 pKa = 3.39HH17 pKa = 6.86EE18 pKa = 4.31AAVNYY23 pKa = 8.26CANPAAALTAAGLEE37 pKa = 4.21AVTPEE42 pKa = 5.07DD43 pKa = 3.4IAAVAPMVAEE53 pKa = 4.18SALVSGGSQLAAIVAAGAGAAASAGLNAVASAATDD88 pKa = 3.57ANLGAGLAAGVNGGAQAGTGLDD110 pKa = 3.16IGLSTGADD118 pKa = 3.19LGAGLSAGLQTAAGLGAGLSAGLGAAAAAGTGAVAGLEE156 pKa = 4.28AGLSAGLGALAGTAASLSQTVSAGANLNTDD186 pKa = 3.01IGADD190 pKa = 3.57LTAGLSTTAAALTDD204 pKa = 3.55ATADD208 pKa = 3.37LTGAINGTLGGITDD222 pKa = 3.96ATTHH226 pKa = 6.81LGTDD230 pKa = 3.6LSAAVNSATHH240 pKa = 5.82VGTDD244 pKa = 3.5LGAALGGSVNTALTGATNIGASLSSGLEE272 pKa = 3.96TGLSGATGVAGDD284 pKa = 4.83LGATLGGAASTGAQLGGNLSGALDD308 pKa = 4.12GAAHH312 pKa = 7.03AGSDD316 pKa = 3.69LGAALGGSLTGGIDD330 pKa = 3.36TGLHH334 pKa = 6.37AGTDD338 pKa = 3.62LGTGLSTGINGTLDD352 pKa = 3.15GATQIGTGLEE362 pKa = 4.17TGLSSGVNGALGGAAQVGTGLSTGVNGAIDD392 pKa = 4.31GVAHH396 pKa = 7.33AGTSLEE402 pKa = 4.51SGLSTGVDD410 pKa = 3.57GALGGAAHH418 pKa = 7.56AGTGLEE424 pKa = 4.48SGLSTGVDD432 pKa = 3.57GALGGAAHH440 pKa = 6.82VGTGLEE446 pKa = 4.29SWLSTGVNGALGGAAHH462 pKa = 7.56AGTGLEE468 pKa = 4.48SGLSTGVDD476 pKa = 3.57GALGGAAHH484 pKa = 6.82VGTGLEE490 pKa = 4.43SGLSTGVNGALGGAAHH506 pKa = 7.56AGTGLEE512 pKa = 4.49SGLSTGIGGALDD524 pKa = 3.68TGLHH528 pKa = 6.25AGGDD532 pKa = 3.69LGAGVTGGVDD542 pKa = 3.57TAAHH546 pKa = 6.12GASNLGGDD554 pKa = 4.49LSTSVGGGANPWAGVDD570 pKa = 3.58VSHH573 pKa = 7.3AFGSGVGASFGAGGLDD589 pKa = 3.4GSLGGSANGAIDD601 pKa = 3.5STLDD605 pKa = 3.42AGGHH609 pKa = 5.73GSLGGGLDD617 pKa = 3.74TTGHH621 pKa = 6.65GSTSLFGDD629 pKa = 4.0TGATATADD637 pKa = 3.3THH639 pKa = 7.03AGGDD643 pKa = 3.36ITGGLLHH650 pKa = 7.16
MM1 pKa = 7.47SPNAILEE8 pKa = 4.84FILSLLRR15 pKa = 11.84DD16 pKa = 3.39HH17 pKa = 6.86EE18 pKa = 4.31AAVNYY23 pKa = 8.26CANPAAALTAAGLEE37 pKa = 4.21AVTPEE42 pKa = 5.07DD43 pKa = 3.4IAAVAPMVAEE53 pKa = 4.18SALVSGGSQLAAIVAAGAGAAASAGLNAVASAATDD88 pKa = 3.57ANLGAGLAAGVNGGAQAGTGLDD110 pKa = 3.16IGLSTGADD118 pKa = 3.19LGAGLSAGLQTAAGLGAGLSAGLGAAAAAGTGAVAGLEE156 pKa = 4.28AGLSAGLGALAGTAASLSQTVSAGANLNTDD186 pKa = 3.01IGADD190 pKa = 3.57LTAGLSTTAAALTDD204 pKa = 3.55ATADD208 pKa = 3.37LTGAINGTLGGITDD222 pKa = 3.96ATTHH226 pKa = 6.81LGTDD230 pKa = 3.6LSAAVNSATHH240 pKa = 5.82VGTDD244 pKa = 3.5LGAALGGSVNTALTGATNIGASLSSGLEE272 pKa = 3.96TGLSGATGVAGDD284 pKa = 4.83LGATLGGAASTGAQLGGNLSGALDD308 pKa = 4.12GAAHH312 pKa = 7.03AGSDD316 pKa = 3.69LGAALGGSLTGGIDD330 pKa = 3.36TGLHH334 pKa = 6.37AGTDD338 pKa = 3.62LGTGLSTGINGTLDD352 pKa = 3.15GATQIGTGLEE362 pKa = 4.17TGLSSGVNGALGGAAQVGTGLSTGVNGAIDD392 pKa = 4.31GVAHH396 pKa = 7.33AGTSLEE402 pKa = 4.51SGLSTGVDD410 pKa = 3.57GALGGAAHH418 pKa = 7.56AGTGLEE424 pKa = 4.48SGLSTGVDD432 pKa = 3.57GALGGAAHH440 pKa = 6.82VGTGLEE446 pKa = 4.29SWLSTGVNGALGGAAHH462 pKa = 7.56AGTGLEE468 pKa = 4.48SGLSTGVDD476 pKa = 3.57GALGGAAHH484 pKa = 6.82VGTGLEE490 pKa = 4.43SGLSTGVNGALGGAAHH506 pKa = 7.56AGTGLEE512 pKa = 4.49SGLSTGIGGALDD524 pKa = 3.68TGLHH528 pKa = 6.25AGGDD532 pKa = 3.69LGAGVTGGVDD542 pKa = 3.57TAAHH546 pKa = 6.12GASNLGGDD554 pKa = 4.49LSTSVGGGANPWAGVDD570 pKa = 3.58VSHH573 pKa = 7.3AFGSGVGASFGAGGLDD589 pKa = 3.4GSLGGSANGAIDD601 pKa = 3.5STLDD605 pKa = 3.42AGGHH609 pKa = 5.73GSLGGGLDD617 pKa = 3.74TTGHH621 pKa = 6.65GSTSLFGDD629 pKa = 4.0TGATATADD637 pKa = 3.3THH639 pKa = 7.03AGGDD643 pKa = 3.36ITGGLLHH650 pKa = 7.16
Molecular weight: 57.72 kDa
Isoelectric point according different methods:
Protein with the highest isoelectric point:
>tr|A0A370I6W6|A0A370I6W6_9NOCA Phospholipid/cholesterol/gamma-HCH transport system ATP-binding protein OS=Nocardia pseudobrasiliensis OX=45979 GN=DFR76_104236 PE=4 SV=1
MM1 pKa = 7.4GSVIKK6 pKa = 10.38KK7 pKa = 8.42RR8 pKa = 11.84RR9 pKa = 11.84KK10 pKa = 9.06RR11 pKa = 11.84MSKK14 pKa = 9.76KK15 pKa = 9.54KK16 pKa = 9.72HH17 pKa = 5.63RR18 pKa = 11.84KK19 pKa = 7.56LLRR22 pKa = 11.84RR23 pKa = 11.84TRR25 pKa = 11.84VQRR28 pKa = 11.84RR29 pKa = 11.84KK30 pKa = 10.11LGKK33 pKa = 9.87
MM1 pKa = 7.4GSVIKK6 pKa = 10.38KK7 pKa = 8.42RR8 pKa = 11.84RR9 pKa = 11.84KK10 pKa = 9.06RR11 pKa = 11.84MSKK14 pKa = 9.76KK15 pKa = 9.54KK16 pKa = 9.72HH17 pKa = 5.63RR18 pKa = 11.84KK19 pKa = 7.56LLRR22 pKa = 11.84RR23 pKa = 11.84TRR25 pKa = 11.84VQRR28 pKa = 11.84RR29 pKa = 11.84KK30 pKa = 10.11LGKK33 pKa = 9.87
Molecular weight: 4.15 kDa
Isoelectric point according different methods:
Peptides (in silico digests for buttom-up proteomics)
Below you can find in silico digests of the whole proteome with Trypsin, Chymotrypsin, Trypsin+LysC, LysN, ArgC proteases suitable for different mass spec machines.| Try ESI |
 |
|---|
| ChTry ESI |
 |
|---|
| ArgC ESI |
 |
|---|
| LysN ESI |
 |
|---|
| TryLysC ESI |
 |
|---|
| Try MALDI |
 |
|---|
| ChTry MALDI |
 |
|---|
| ArgC MALDI |
 |
|---|
| LysN MALDI |
 |
|---|
| TryLysC MALDI |
 |
|---|
| Try LTQ |
 |
|---|
| ChTry LTQ |
 |
|---|
| ArgC LTQ |
 |
|---|
| LysN LTQ |
 |
|---|
| TryLysC LTQ |
 |
|---|
| Try MSlow |
 |
|---|
| ChTry MSlow |
 |
|---|
| ArgC MSlow |
 |
|---|
| LysN MSlow |
 |
|---|
| TryLysC MSlow |
 |
|---|
| Try MShigh |
 |
|---|
| ChTry MShigh |
 |
|---|
| ArgC MShigh |
 |
|---|
| LysN MShigh |
 |
|---|
| TryLysC MShigh |
 |
|---|
General Statistics
Number of major isoforms |
Number of additional isoforms |
Number of all proteins |
Number of amino acids |
Min. Seq. Length |
Max. Seq. Length |
Avg. Seq. Length |
Avg. Mol. Weight |
|---|---|---|---|---|---|---|---|
0 |
2519924 |
29 |
14540 |
317.3 |
34.14 |
Amino acid frequency
Ala |
Cys |
Asp |
Glu |
Phe |
Gly |
His |
Ile |
Lys |
Leu |
|---|---|---|---|---|---|---|---|---|---|
13.224 ± 0.038 | 0.781 ± 0.01 |
6.096 ± 0.024 | 5.423 ± 0.031 |
2.976 ± 0.017 | 8.873 ± 0.027 |
2.246 ± 0.016 | 4.267 ± 0.019 |
1.848 ± 0.021 | 10.289 ± 0.029 |
Met |
Asn |
Gln |
Pro |
Arg |
Ser |
Thr |
Val |
Trp |
Tyr |
|---|---|---|---|---|---|---|---|---|---|
1.877 ± 0.011 | 2.051 ± 0.015 |
5.925 ± 0.026 | 2.819 ± 0.016 |
8.017 ± 0.033 | 5.178 ± 0.02 |
6.066 ± 0.022 | 8.392 ± 0.031 |
1.507 ± 0.012 | 2.146 ± 0.013 |
Most of the basic statistics you can see at this page can be downloaded from this CSV file
Proteome-pI is available under Creative Commons Attribution-NoDerivs license, for more details see here
| Reference: Kozlowski LP. Proteome-pI 2.0: Proteome Isoelectric Point Database Update. Nucleic Acids Res. 2021, doi: 10.1093/nar/gkab944 | Contact: Lukasz P. Kozlowski |
