Shimia thalassica
Taxonomy: cellular organisms; Bacteria; Proteobacteria; Alphaproteobacteria; Rhodobacterales; Roseobacteraceae; Shimia
Average proteome isoelectric point is 5.93
Get precalculated fractions of proteins

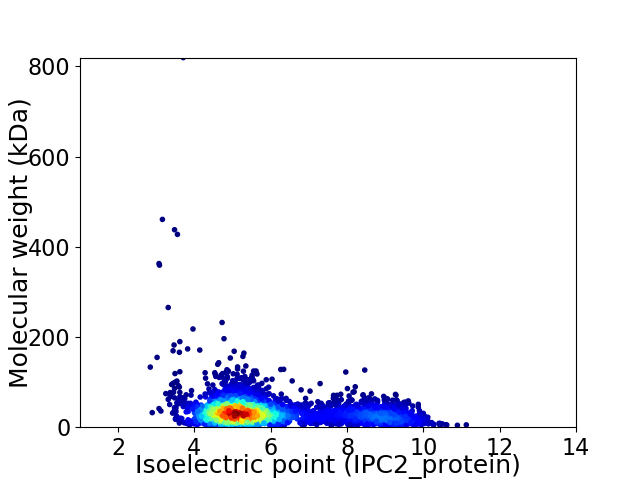
Virtual 2D-PAGE plot for 4063 proteins (isoelectric point calculated using IPC2_protein)
Get csv file with sequences according to given criteria:
* You can choose from 21 different methods for calculating isoelectric point
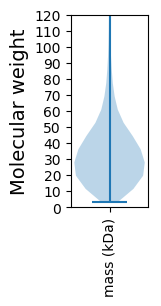
Summary statistics related to proteome-wise predictions


Protein with the lowest isoelectric point:
>tr|A0A0P1I5X0|A0A0P1I5X0_9RHOB Probable multidrug resistance protein NorM OS=Shimia thalassica OX=1715693 GN=mepA_2 PE=4 SV=1
MM1 pKa = 6.96MAFSIRR7 pKa = 11.84VFDD10 pKa = 4.25MIYY13 pKa = 10.73EE14 pKa = 4.45VIGTAADD21 pKa = 3.95DD22 pKa = 5.48LIVAPPNPNNQAVIYY37 pKa = 9.88GRR39 pKa = 11.84EE40 pKa = 4.0GDD42 pKa = 4.39DD43 pKa = 3.55VLAAHH48 pKa = 6.94SNNANNNDD56 pKa = 3.81TLRR59 pKa = 11.84GDD61 pKa = 3.69SGNDD65 pKa = 2.98TLYY68 pKa = 10.91AGNGGDD74 pKa = 3.89VLFGGPDD81 pKa = 3.76DD82 pKa = 5.59DD83 pKa = 6.25LLFGPSGHH91 pKa = 6.14GHH93 pKa = 5.68ATLNGGTGDD102 pKa = 3.98DD103 pKa = 4.39TISSASLTRR112 pKa = 11.84SYY114 pKa = 10.49LGPMQVHH121 pKa = 6.63GGEE124 pKa = 4.33GDD126 pKa = 3.87DD127 pKa = 4.54VIHH130 pKa = 7.09LGGGNHH136 pKa = 7.67WIYY139 pKa = 11.16GDD141 pKa = 3.85NGNDD145 pKa = 4.49LIVGSHH151 pKa = 6.51KK152 pKa = 10.43FFNWEE157 pKa = 4.05HH158 pKa = 6.36LFGGAGNDD166 pKa = 4.03TILGQQGEE174 pKa = 4.45DD175 pKa = 3.76TISGGSGDD183 pKa = 3.8DD184 pKa = 3.81ALWGGNLSDD193 pKa = 5.17HH194 pKa = 7.04IYY196 pKa = 11.01GGTGDD201 pKa = 4.54DD202 pKa = 3.64RR203 pKa = 11.84LFGGQYY209 pKa = 11.09GDD211 pKa = 3.8TLQGGDD217 pKa = 3.81GFDD220 pKa = 5.51FIDD223 pKa = 4.48GGNGVDD229 pKa = 4.73DD230 pKa = 4.19LWGGADD236 pKa = 3.27EE237 pKa = 4.76DD238 pKa = 3.72RR239 pKa = 11.84FYY241 pKa = 11.51RR242 pKa = 11.84EE243 pKa = 3.52ASDD246 pKa = 3.71YY247 pKa = 11.29LFDD250 pKa = 6.48RR251 pKa = 11.84IHH253 pKa = 7.58DD254 pKa = 3.99YY255 pKa = 11.01DD256 pKa = 4.17ASEE259 pKa = 4.31GDD261 pKa = 3.62LLHH264 pKa = 7.12FGGEE268 pKa = 4.31AYY270 pKa = 10.23NANQFHH276 pKa = 6.49VSFHH280 pKa = 5.29NTNNGEE286 pKa = 4.14AGIQDD291 pKa = 4.89AIITYY296 pKa = 10.57APTNQVLWILTDD308 pKa = 3.44VEE310 pKa = 4.27HH311 pKa = 7.92AEE313 pKa = 4.88DD314 pKa = 3.3INIRR318 pKa = 11.84LFTGATIDD326 pKa = 4.94LII328 pKa = 4.35
MM1 pKa = 6.96MAFSIRR7 pKa = 11.84VFDD10 pKa = 4.25MIYY13 pKa = 10.73EE14 pKa = 4.45VIGTAADD21 pKa = 3.95DD22 pKa = 5.48LIVAPPNPNNQAVIYY37 pKa = 9.88GRR39 pKa = 11.84EE40 pKa = 4.0GDD42 pKa = 4.39DD43 pKa = 3.55VLAAHH48 pKa = 6.94SNNANNNDD56 pKa = 3.81TLRR59 pKa = 11.84GDD61 pKa = 3.69SGNDD65 pKa = 2.98TLYY68 pKa = 10.91AGNGGDD74 pKa = 3.89VLFGGPDD81 pKa = 3.76DD82 pKa = 5.59DD83 pKa = 6.25LLFGPSGHH91 pKa = 6.14GHH93 pKa = 5.68ATLNGGTGDD102 pKa = 3.98DD103 pKa = 4.39TISSASLTRR112 pKa = 11.84SYY114 pKa = 10.49LGPMQVHH121 pKa = 6.63GGEE124 pKa = 4.33GDD126 pKa = 3.87DD127 pKa = 4.54VIHH130 pKa = 7.09LGGGNHH136 pKa = 7.67WIYY139 pKa = 11.16GDD141 pKa = 3.85NGNDD145 pKa = 4.49LIVGSHH151 pKa = 6.51KK152 pKa = 10.43FFNWEE157 pKa = 4.05HH158 pKa = 6.36LFGGAGNDD166 pKa = 4.03TILGQQGEE174 pKa = 4.45DD175 pKa = 3.76TISGGSGDD183 pKa = 3.8DD184 pKa = 3.81ALWGGNLSDD193 pKa = 5.17HH194 pKa = 7.04IYY196 pKa = 11.01GGTGDD201 pKa = 4.54DD202 pKa = 3.64RR203 pKa = 11.84LFGGQYY209 pKa = 11.09GDD211 pKa = 3.8TLQGGDD217 pKa = 3.81GFDD220 pKa = 5.51FIDD223 pKa = 4.48GGNGVDD229 pKa = 4.73DD230 pKa = 4.19LWGGADD236 pKa = 3.27EE237 pKa = 4.76DD238 pKa = 3.72RR239 pKa = 11.84FYY241 pKa = 11.51RR242 pKa = 11.84EE243 pKa = 3.52ASDD246 pKa = 3.71YY247 pKa = 11.29LFDD250 pKa = 6.48RR251 pKa = 11.84IHH253 pKa = 7.58DD254 pKa = 3.99YY255 pKa = 11.01DD256 pKa = 4.17ASEE259 pKa = 4.31GDD261 pKa = 3.62LLHH264 pKa = 7.12FGGEE268 pKa = 4.31AYY270 pKa = 10.23NANQFHH276 pKa = 6.49VSFHH280 pKa = 5.29NTNNGEE286 pKa = 4.14AGIQDD291 pKa = 4.89AIITYY296 pKa = 10.57APTNQVLWILTDD308 pKa = 3.44VEE310 pKa = 4.27HH311 pKa = 7.92AEE313 pKa = 4.88DD314 pKa = 3.3INIRR318 pKa = 11.84LFTGATIDD326 pKa = 4.94LII328 pKa = 4.35
Molecular weight: 34.88 kDa
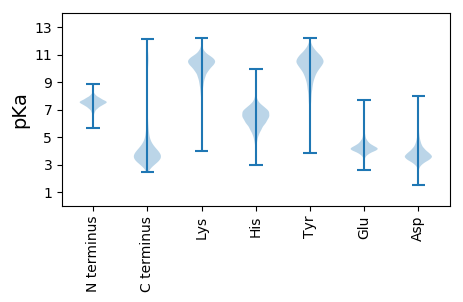
Isoelectric point according different methods:
Protein with the highest isoelectric point:
>tr|A0A0P1IJD5|A0A0P1IJD5_9RHOB 4-diphosphocytidyl-2-C-methyl-D-erythritol kinase OS=Shimia thalassica OX=1715693 GN=ispE PE=3 SV=1
MM1 pKa = 7.35KK2 pKa = 9.44RR3 pKa = 11.84TYY5 pKa = 10.31QPSNLVRR12 pKa = 11.84KK13 pKa = 9.18RR14 pKa = 11.84RR15 pKa = 11.84HH16 pKa = 4.42GFRR19 pKa = 11.84ARR21 pKa = 11.84MATKK25 pKa = 10.37AGRR28 pKa = 11.84KK29 pKa = 8.54ILNARR34 pKa = 11.84RR35 pKa = 11.84ARR37 pKa = 11.84GRR39 pKa = 11.84KK40 pKa = 9.07SLSAA44 pKa = 3.93
MM1 pKa = 7.35KK2 pKa = 9.44RR3 pKa = 11.84TYY5 pKa = 10.31QPSNLVRR12 pKa = 11.84KK13 pKa = 9.18RR14 pKa = 11.84RR15 pKa = 11.84HH16 pKa = 4.42GFRR19 pKa = 11.84ARR21 pKa = 11.84MATKK25 pKa = 10.37AGRR28 pKa = 11.84KK29 pKa = 8.54ILNARR34 pKa = 11.84RR35 pKa = 11.84ARR37 pKa = 11.84GRR39 pKa = 11.84KK40 pKa = 9.07SLSAA44 pKa = 3.93
Molecular weight: 5.15 kDa
Isoelectric point according different methods:
Peptides (in silico digests for buttom-up proteomics)
Below you can find in silico digests of the whole proteome with Trypsin, Chymotrypsin, Trypsin+LysC, LysN, ArgC proteases suitable for different mass spec machines.| Try ESI |
 |
|---|
| ChTry ESI |
 |
|---|
| ArgC ESI |
 |
|---|
| LysN ESI |
 |
|---|
| TryLysC ESI |
 |
|---|
| Try MALDI |
 |
|---|
| ChTry MALDI |
 |
|---|
| ArgC MALDI |
 |
|---|
| LysN MALDI |
 |
|---|
| TryLysC MALDI |
 |
|---|
| Try LTQ |
 |
|---|
| ChTry LTQ |
 |
|---|
| ArgC LTQ |
 |
|---|
| LysN LTQ |
 |
|---|
| TryLysC LTQ |
 |
|---|
| Try MSlow |
 |
|---|
| ChTry MSlow |
 |
|---|
| ArgC MSlow |
 |
|---|
| LysN MSlow |
 |
|---|
| TryLysC MSlow |
 |
|---|
| Try MShigh |
 |
|---|
| ChTry MShigh |
 |
|---|
| ArgC MShigh |
 |
|---|
| LysN MShigh |
 |
|---|
| TryLysC MShigh |
 |
|---|
General Statistics
Number of major isoforms |
Number of additional isoforms |
Number of all proteins |
Number of amino acids |
Min. Seq. Length |
Max. Seq. Length |
Avg. Seq. Length |
Avg. Mol. Weight |
|---|---|---|---|---|---|---|---|
0 |
1322757 |
29 |
8219 |
325.6 |
35.43 |
Amino acid frequency
Ala |
Cys |
Asp |
Glu |
Phe |
Gly |
His |
Ile |
Lys |
Leu |
|---|---|---|---|---|---|---|---|---|---|
11.001 ± 0.05 | 0.887 ± 0.015 |
6.446 ± 0.065 | 6.031 ± 0.04 |
3.995 ± 0.028 | 8.716 ± 0.08 |
2.094 ± 0.023 | 5.309 ± 0.031 |
3.651 ± 0.04 | 9.737 ± 0.042 |
Met |
Asn |
Gln |
Pro |
Arg |
Ser |
Thr |
Val |
Trp |
Tyr |
|---|---|---|---|---|---|---|---|---|---|
2.839 ± 0.027 | 3.077 ± 0.029 |
4.678 ± 0.037 | 3.307 ± 0.024 |
5.786 ± 0.046 | 5.696 ± 0.037 |
5.686 ± 0.044 | 7.366 ± 0.034 |
1.374 ± 0.017 | 2.323 ± 0.022 |
Most of the basic statistics you can see at this page can be downloaded from this CSV file
Proteome-pI is available under Creative Commons Attribution-NoDerivs license, for more details see here
| Reference: Kozlowski LP. Proteome-pI 2.0: Proteome Isoelectric Point Database Update. Nucleic Acids Res. 2021, doi: 10.1093/nar/gkab944 | Contact: Lukasz P. Kozlowski |
