Rhodococcus sp. RD6.2
Taxonomy: cellular organisms; Bacteria; Terrabacteria group; Actinobacteria; Actinomycetia; Corynebacteriales; Nocardiaceae; Rhodococcus; unclassified Rhodococcus
Average proteome isoelectric point is 6.0
Get precalculated fractions of proteins

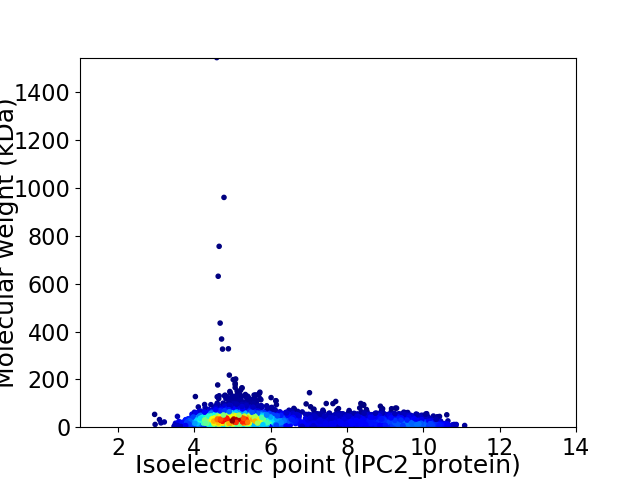
Virtual 2D-PAGE plot for 5489 proteins (isoelectric point calculated using IPC2_protein)
Get csv file with sequences according to given criteria:
* You can choose from 21 different methods for calculating isoelectric point
Summary statistics related to proteome-wise predictions


Protein with the lowest isoelectric point:
>tr|A0A0K2YMA5|A0A0K2YMA5_9NOCA Uncharacterized protein OS=Rhodococcus sp. RD6.2 OX=260936 GN=RHCRD62_40556 PE=4 SV=1
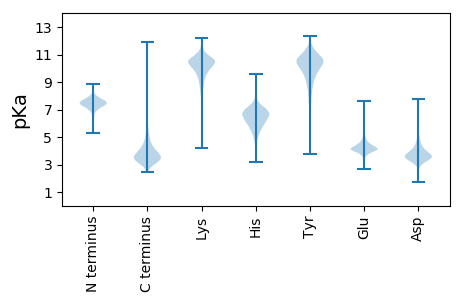
MM1 pKa = 7.38SHH3 pKa = 7.26PFDD6 pKa = 4.14MNSDD10 pKa = 3.62PTVVIPRR17 pKa = 11.84VEE19 pKa = 4.13PEE21 pKa = 4.4PEE23 pKa = 4.28PEE25 pKa = 4.21PEE27 pKa = 4.19PTPEE31 pKa = 4.13APASSGARR39 pKa = 11.84GKK41 pKa = 9.96IVAVGASVAALVLGAAAGYY60 pKa = 8.81FAGSSGSSSEE70 pKa = 4.02PATVPVAATTVAPPTTTSAAPAPGPGMFLAASGTVDD106 pKa = 4.3TIAGDD111 pKa = 3.86TFVLKK116 pKa = 10.97AEE118 pKa = 5.21DD119 pKa = 3.88GTKK122 pKa = 9.08VTIGTTAATRR132 pKa = 11.84IVTLQGDD139 pKa = 3.93EE140 pKa = 4.69FEE142 pKa = 5.03DD143 pKa = 5.13LEE145 pKa = 5.58IGDD148 pKa = 4.05AAVVQGEE155 pKa = 4.03QSGGNFVADD164 pKa = 3.83LVIAGALSGLLPTTEE179 pKa = 3.96AAAPANAVQQQTMDD193 pKa = 3.64QVPQPTWRR201 pKa = 11.84ATAAPTTTQVPEE213 pKa = 4.18SAPMDD218 pKa = 3.7GSGPSGGYY226 pKa = 10.46GPTGQYY232 pKa = 10.95GPDD235 pKa = 3.62GDD237 pKa = 4.34YY238 pKa = 11.52GPDD241 pKa = 3.54GDD243 pKa = 4.8YY244 pKa = 11.32GPSGNYY250 pKa = 10.08GPDD253 pKa = 3.37GDD255 pKa = 4.67YY256 pKa = 11.31GPSGNYY262 pKa = 9.4GPRR265 pKa = 11.84GDD267 pKa = 3.64YY268 pKa = 10.61GPRR271 pKa = 11.84GGYY274 pKa = 10.21GPDD277 pKa = 3.23GGYY280 pKa = 10.96GPDD283 pKa = 3.3GGYY286 pKa = 10.78GPRR289 pKa = 3.92
MM1 pKa = 7.38SHH3 pKa = 7.26PFDD6 pKa = 4.14MNSDD10 pKa = 3.62PTVVIPRR17 pKa = 11.84VEE19 pKa = 4.13PEE21 pKa = 4.4PEE23 pKa = 4.28PEE25 pKa = 4.21PEE27 pKa = 4.19PTPEE31 pKa = 4.13APASSGARR39 pKa = 11.84GKK41 pKa = 9.96IVAVGASVAALVLGAAAGYY60 pKa = 8.81FAGSSGSSSEE70 pKa = 4.02PATVPVAATTVAPPTTTSAAPAPGPGMFLAASGTVDD106 pKa = 4.3TIAGDD111 pKa = 3.86TFVLKK116 pKa = 10.97AEE118 pKa = 5.21DD119 pKa = 3.88GTKK122 pKa = 9.08VTIGTTAATRR132 pKa = 11.84IVTLQGDD139 pKa = 3.93EE140 pKa = 4.69FEE142 pKa = 5.03DD143 pKa = 5.13LEE145 pKa = 5.58IGDD148 pKa = 4.05AAVVQGEE155 pKa = 4.03QSGGNFVADD164 pKa = 3.83LVIAGALSGLLPTTEE179 pKa = 3.96AAAPANAVQQQTMDD193 pKa = 3.64QVPQPTWRR201 pKa = 11.84ATAAPTTTQVPEE213 pKa = 4.18SAPMDD218 pKa = 3.7GSGPSGGYY226 pKa = 10.46GPTGQYY232 pKa = 10.95GPDD235 pKa = 3.62GDD237 pKa = 4.34YY238 pKa = 11.52GPDD241 pKa = 3.54GDD243 pKa = 4.8YY244 pKa = 11.32GPSGNYY250 pKa = 10.08GPDD253 pKa = 3.37GDD255 pKa = 4.67YY256 pKa = 11.31GPSGNYY262 pKa = 9.4GPRR265 pKa = 11.84GDD267 pKa = 3.64YY268 pKa = 10.61GPRR271 pKa = 11.84GGYY274 pKa = 10.21GPDD277 pKa = 3.23GGYY280 pKa = 10.96GPDD283 pKa = 3.3GGYY286 pKa = 10.78GPRR289 pKa = 3.92
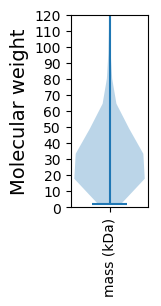
Molecular weight: 28.5 kDa
Isoelectric point according different methods:
Protein with the highest isoelectric point:
>tr|A0A0K2YSY6|A0A0K2YSY6_9NOCA Uncharacterized protein OS=Rhodococcus sp. RD6.2 OX=260936 GN=RHCRD62_70299 PE=4 SV=1
MM1 pKa = 7.15HH2 pKa = 7.4RR3 pKa = 11.84SSRR6 pKa = 11.84RR7 pKa = 11.84AAAFRR12 pKa = 11.84PRR14 pKa = 11.84RR15 pKa = 11.84NAAMYY20 pKa = 8.46PRR22 pKa = 11.84RR23 pKa = 11.84TAVTSPRR30 pKa = 11.84RR31 pKa = 11.84NAAMFPRR38 pKa = 11.84RR39 pKa = 11.84AIRR42 pKa = 11.84RR43 pKa = 11.84PRR45 pKa = 11.84PRR47 pKa = 11.84IGSSLDD53 pKa = 3.2HH54 pKa = 6.75RR55 pKa = 11.84PARR58 pKa = 11.84APRR61 pKa = 3.74
MM1 pKa = 7.15HH2 pKa = 7.4RR3 pKa = 11.84SSRR6 pKa = 11.84RR7 pKa = 11.84AAAFRR12 pKa = 11.84PRR14 pKa = 11.84RR15 pKa = 11.84NAAMYY20 pKa = 8.46PRR22 pKa = 11.84RR23 pKa = 11.84TAVTSPRR30 pKa = 11.84RR31 pKa = 11.84NAAMFPRR38 pKa = 11.84RR39 pKa = 11.84AIRR42 pKa = 11.84RR43 pKa = 11.84PRR45 pKa = 11.84PRR47 pKa = 11.84IGSSLDD53 pKa = 3.2HH54 pKa = 6.75RR55 pKa = 11.84PARR58 pKa = 11.84APRR61 pKa = 3.74
Molecular weight: 7.15 kDa
Isoelectric point according different methods:
Peptides (in silico digests for buttom-up proteomics)
Below you can find in silico digests of the whole proteome with Trypsin, Chymotrypsin, Trypsin+LysC, LysN, ArgC proteases suitable for different mass spec machines.| Try ESI |
 |
|---|
| ChTry ESI |
 |
|---|
| ArgC ESI |
 |
|---|
| LysN ESI |
 |
|---|
| TryLysC ESI |
 |
|---|
| Try MALDI |
 |
|---|
| ChTry MALDI |
 |
|---|
| ArgC MALDI |
 |
|---|
| LysN MALDI |
 |
|---|
| TryLysC MALDI |
 |
|---|
| Try LTQ |
 |
|---|
| ChTry LTQ |
 |
|---|
| ArgC LTQ |
 |
|---|
| LysN LTQ |
 |
|---|
| TryLysC LTQ |
 |
|---|
| Try MSlow |
 |
|---|
| ChTry MSlow |
 |
|---|
| ArgC MSlow |
 |
|---|
| LysN MSlow |
 |
|---|
| TryLysC MSlow |
 |
|---|
| Try MShigh |
 |
|---|
| ChTry MShigh |
 |
|---|
| ArgC MShigh |
 |
|---|
| LysN MShigh |
 |
|---|
| TryLysC MShigh |
 |
|---|
General Statistics
Number of major isoforms |
Number of additional isoforms |
Number of all proteins |
Number of amino acids |
Min. Seq. Length |
Max. Seq. Length |
Avg. Seq. Length |
Avg. Mol. Weight |
|---|---|---|---|---|---|---|---|
0 |
1736644 |
20 |
14536 |
316.4 |
33.8 |
Amino acid frequency
Ala |
Cys |
Asp |
Glu |
Phe |
Gly |
His |
Ile |
Lys |
Leu |
|---|---|---|---|---|---|---|---|---|---|
13.105 ± 0.04 | 0.76 ± 0.012 |
6.505 ± 0.035 | 5.322 ± 0.027 |
2.917 ± 0.018 | 9.19 ± 0.035 |
2.154 ± 0.015 | 3.889 ± 0.025 |
1.885 ± 0.023 | 9.832 ± 0.031 |
Met |
Asn |
Gln |
Pro |
Arg |
Ser |
Thr |
Val |
Trp |
Tyr |
|---|---|---|---|---|---|---|---|---|---|
1.952 ± 0.013 | 1.99 ± 0.018 |
5.683 ± 0.027 | 2.664 ± 0.018 |
7.498 ± 0.032 | 5.551 ± 0.024 |
6.426 ± 0.028 | 9.274 ± 0.035 |
1.447 ± 0.014 | 1.954 ± 0.016 |
Most of the basic statistics you can see at this page can be downloaded from this CSV file
Proteome-pI is available under Creative Commons Attribution-NoDerivs license, for more details see here
| Reference: Kozlowski LP. Proteome-pI 2.0: Proteome Isoelectric Point Database Update. Nucleic Acids Res. 2021, doi: 10.1093/nar/gkab944 | Contact: Lukasz P. Kozlowski |
