Mycobacterium virus Ardmore
Taxonomy: Viruses; Duplodnaviria; Heunggongvirae; Uroviricota; Caudoviricetes; Caudovirales; Siphoviridae; Cheoctovirus
Average proteome isoelectric point is 6.04
Get precalculated fractions of proteins

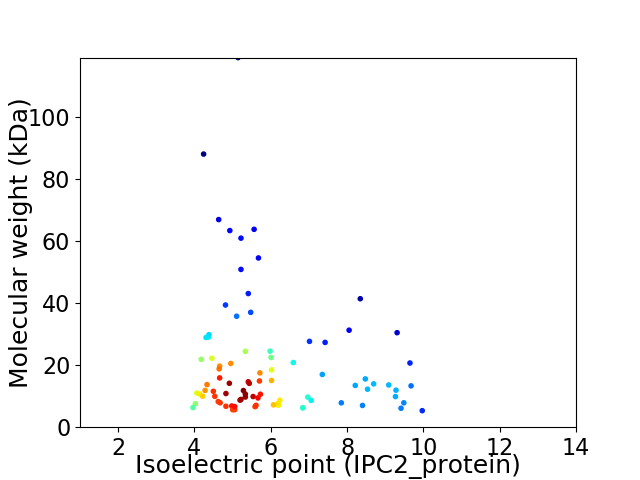
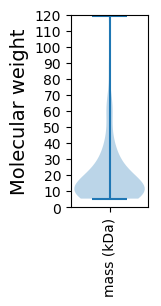
Virtual 2D-PAGE plot for 87 proteins (isoelectric point calculated using IPC2_protein)
Get csv file with sequences according to given criteria:
* You can choose from 21 different methods for calculating isoelectric point
Summary statistics related to proteome-wise predictions


Protein with the lowest isoelectric point:
>tr|D4N7J5|D4N7J5_9CAUD Gp50 OS=Mycobacterium virus Ardmore OX=685506 GN=Ardmore_50 PE=3 SV=1
MM1 pKa = 7.36AHH3 pKa = 6.42WKK5 pKa = 9.59YY6 pKa = 8.91WWTMPLLIAAGIIGPGLAAPEE27 pKa = 4.19AKK29 pKa = 10.36ADD31 pKa = 3.49ITSDD35 pKa = 3.54AFVMALDD42 pKa = 4.35SEE44 pKa = 5.11GITYY48 pKa = 10.39SSKK51 pKa = 10.3PAVINAGKK59 pKa = 10.01AVCDD63 pKa = 3.93VLDD66 pKa = 3.65TGYY69 pKa = 9.51TMYY72 pKa = 10.19EE73 pKa = 3.7ASVFVYY79 pKa = 10.8NNSNLDD85 pKa = 3.99LYY87 pKa = 11.33DD88 pKa = 3.2SGYY91 pKa = 10.79FVGAATASFCPEE103 pKa = 4.1HH104 pKa = 7.29LSGTGWVV111 pKa = 3.57
MM1 pKa = 7.36AHH3 pKa = 6.42WKK5 pKa = 9.59YY6 pKa = 8.91WWTMPLLIAAGIIGPGLAAPEE27 pKa = 4.19AKK29 pKa = 10.36ADD31 pKa = 3.49ITSDD35 pKa = 3.54AFVMALDD42 pKa = 4.35SEE44 pKa = 5.11GITYY48 pKa = 10.39SSKK51 pKa = 10.3PAVINAGKK59 pKa = 10.01AVCDD63 pKa = 3.93VLDD66 pKa = 3.65TGYY69 pKa = 9.51TMYY72 pKa = 10.19EE73 pKa = 3.7ASVFVYY79 pKa = 10.8NNSNLDD85 pKa = 3.99LYY87 pKa = 11.33DD88 pKa = 3.2SGYY91 pKa = 10.79FVGAATASFCPEE103 pKa = 4.1HH104 pKa = 7.29LSGTGWVV111 pKa = 3.57
Molecular weight: 11.85 kDa
Isoelectric point according different methods:
Protein with the highest isoelectric point:
>tr|D4N7N3|D4N7N3_9CAUD Gp88 OS=Mycobacterium virus Ardmore OX=685506 GN=Ardmore_88 PE=4 SV=1
MM1 pKa = 7.49GRR3 pKa = 11.84LQRR6 pKa = 11.84TRR8 pKa = 11.84TRR10 pKa = 11.84RR11 pKa = 11.84HH12 pKa = 5.3RR13 pKa = 11.84RR14 pKa = 11.84EE15 pKa = 3.67NPIQRR20 pKa = 11.84LGQMLHH26 pKa = 5.36RR27 pKa = 11.84HH28 pKa = 5.72RR29 pKa = 11.84PRR31 pKa = 11.84IRR33 pKa = 11.84LRR35 pKa = 11.84QHH37 pKa = 5.73HH38 pKa = 5.91TTTHH42 pKa = 4.96TTHH45 pKa = 6.13HH46 pKa = 6.6CRR48 pKa = 11.84RR49 pKa = 11.84EE50 pKa = 4.05NHH52 pKa = 4.16THH54 pKa = 6.66KK55 pKa = 10.61ATMTHH60 pKa = 6.79TIGIVAHH67 pKa = 5.88TKK69 pKa = 10.1RR70 pKa = 11.84AEE72 pKa = 3.89QAHH75 pKa = 6.23RR76 pKa = 11.84LMEE79 pKa = 4.5TVGAAYY85 pKa = 9.34MSIDD89 pKa = 3.55NGALGCEE96 pKa = 4.04ANHH99 pKa = 5.83RR100 pKa = 11.84KK101 pKa = 8.63VWQHH105 pKa = 5.26LTRR108 pKa = 11.84HH109 pKa = 4.75NTDD112 pKa = 2.58WLVVLEE118 pKa = 5.42DD119 pKa = 5.08DD120 pKa = 6.82AIPCDD125 pKa = 3.67NFRR128 pKa = 11.84DD129 pKa = 3.89QLDD132 pKa = 3.5AALAVAPSPVVSLYY146 pKa = 10.76LGRR149 pKa = 11.84EE150 pKa = 3.91RR151 pKa = 11.84PRR153 pKa = 11.84EE154 pKa = 3.87YY155 pKa = 10.07QQRR158 pKa = 11.84IAKK161 pKa = 9.98AADD164 pKa = 3.74TTAHH168 pKa = 7.01WLTCRR173 pKa = 11.84RR174 pKa = 11.84LLHH177 pKa = 6.2AVGIAIHH184 pKa = 6.94ADD186 pKa = 4.01LVPHH190 pKa = 6.61MLNNLPNGKK199 pKa = 9.05PIDD202 pKa = 3.82EE203 pKa = 5.84AISAWARR210 pKa = 11.84HH211 pKa = 4.88QSHH214 pKa = 7.09TIAYY218 pKa = 6.61TWPSLIDD225 pKa = 3.88HH226 pKa = 7.19ADD228 pKa = 3.84EE229 pKa = 4.5TPMIATRR236 pKa = 11.84NDD238 pKa = 3.26NQPRR242 pKa = 11.84TPGRR246 pKa = 11.84VAWQHH251 pKa = 4.69GTRR254 pKa = 11.84DD255 pKa = 2.96TWTTDD260 pKa = 3.15TQPII264 pKa = 3.83
MM1 pKa = 7.49GRR3 pKa = 11.84LQRR6 pKa = 11.84TRR8 pKa = 11.84TRR10 pKa = 11.84RR11 pKa = 11.84HH12 pKa = 5.3RR13 pKa = 11.84RR14 pKa = 11.84EE15 pKa = 3.67NPIQRR20 pKa = 11.84LGQMLHH26 pKa = 5.36RR27 pKa = 11.84HH28 pKa = 5.72RR29 pKa = 11.84PRR31 pKa = 11.84IRR33 pKa = 11.84LRR35 pKa = 11.84QHH37 pKa = 5.73HH38 pKa = 5.91TTTHH42 pKa = 4.96TTHH45 pKa = 6.13HH46 pKa = 6.6CRR48 pKa = 11.84RR49 pKa = 11.84EE50 pKa = 4.05NHH52 pKa = 4.16THH54 pKa = 6.66KK55 pKa = 10.61ATMTHH60 pKa = 6.79TIGIVAHH67 pKa = 5.88TKK69 pKa = 10.1RR70 pKa = 11.84AEE72 pKa = 3.89QAHH75 pKa = 6.23RR76 pKa = 11.84LMEE79 pKa = 4.5TVGAAYY85 pKa = 9.34MSIDD89 pKa = 3.55NGALGCEE96 pKa = 4.04ANHH99 pKa = 5.83RR100 pKa = 11.84KK101 pKa = 8.63VWQHH105 pKa = 5.26LTRR108 pKa = 11.84HH109 pKa = 4.75NTDD112 pKa = 2.58WLVVLEE118 pKa = 5.42DD119 pKa = 5.08DD120 pKa = 6.82AIPCDD125 pKa = 3.67NFRR128 pKa = 11.84DD129 pKa = 3.89QLDD132 pKa = 3.5AALAVAPSPVVSLYY146 pKa = 10.76LGRR149 pKa = 11.84EE150 pKa = 3.91RR151 pKa = 11.84PRR153 pKa = 11.84EE154 pKa = 3.87YY155 pKa = 10.07QQRR158 pKa = 11.84IAKK161 pKa = 9.98AADD164 pKa = 3.74TTAHH168 pKa = 7.01WLTCRR173 pKa = 11.84RR174 pKa = 11.84LLHH177 pKa = 6.2AVGIAIHH184 pKa = 6.94ADD186 pKa = 4.01LVPHH190 pKa = 6.61MLNNLPNGKK199 pKa = 9.05PIDD202 pKa = 3.82EE203 pKa = 5.84AISAWARR210 pKa = 11.84HH211 pKa = 4.88QSHH214 pKa = 7.09TIAYY218 pKa = 6.61TWPSLIDD225 pKa = 3.88HH226 pKa = 7.19ADD228 pKa = 3.84EE229 pKa = 4.5TPMIATRR236 pKa = 11.84NDD238 pKa = 3.26NQPRR242 pKa = 11.84TPGRR246 pKa = 11.84VAWQHH251 pKa = 4.69GTRR254 pKa = 11.84DD255 pKa = 2.96TWTTDD260 pKa = 3.15TQPII264 pKa = 3.83
Molecular weight: 30.48 kDa
Isoelectric point according different methods:
Peptides (in silico digests for buttom-up proteomics)
Below you can find in silico digests of the whole proteome with Trypsin, Chymotrypsin, Trypsin+LysC, LysN, ArgC proteases suitable for different mass spec machines.| Try ESI |
 |
|---|
| ChTry ESI |
 |
|---|
| ArgC ESI |
 |
|---|
| LysN ESI |
 |
|---|
| TryLysC ESI |
 |
|---|
| Try MALDI |
 |
|---|
| ChTry MALDI |
 |
|---|
| ArgC MALDI |
 |
|---|
| LysN MALDI |
 |
|---|
| TryLysC MALDI |
 |
|---|
| Try LTQ |
 |
|---|
| ChTry LTQ |
 |
|---|
| ArgC LTQ |
 |
|---|
| LysN LTQ |
 |
|---|
| TryLysC LTQ |
 |
|---|
| Try MSlow |
 |
|---|
| ChTry MSlow |
 |
|---|
| ArgC MSlow |
 |
|---|
| LysN MSlow |
 |
|---|
| TryLysC MSlow |
 |
|---|
| Try MShigh |
 |
|---|
| ChTry MShigh |
 |
|---|
| ArgC MShigh |
 |
|---|
| LysN MShigh |
 |
|---|
| TryLysC MShigh |
 |
|---|
General Statistics
Number of major isoforms |
Number of additional isoforms |
Number of all proteins |
Number of amino acids |
Min. Seq. Length |
Max. Seq. Length |
Avg. Seq. Length |
Avg. Mol. Weight |
|---|---|---|---|---|---|---|---|
0 |
16213 |
48 |
1175 |
186.4 |
20.36 |
Amino acid frequency
Ala |
Cys |
Asp |
Glu |
Phe |
Gly |
His |
Ile |
Lys |
Leu |
|---|---|---|---|---|---|---|---|---|---|
10.689 ± 0.473 | 1.135 ± 0.151 |
6.735 ± 0.188 | 5.637 ± 0.324 |
2.936 ± 0.217 | 8.962 ± 0.568 |
2.362 ± 0.217 | 4.281 ± 0.189 |
3.121 ± 0.18 | 7.34 ± 0.232 |
Met |
Asn |
Gln |
Pro |
Arg |
Ser |
Thr |
Val |
Trp |
Tyr |
|---|---|---|---|---|---|---|---|---|---|
2.288 ± 0.135 | 3.479 ± 0.182 |
5.952 ± 0.236 | 3.436 ± 0.187 |
6.908 ± 0.453 | 5.964 ± 0.251 |
6.717 ± 0.293 | 7.186 ± 0.308 |
2.368 ± 0.167 | 2.504 ± 0.176 |
Most of the basic statistics you can see at this page can be downloaded from this CSV file
Proteome-pI is available under Creative Commons Attribution-NoDerivs license, for more details see here
| Reference: Kozlowski LP. Proteome-pI 2.0: Proteome Isoelectric Point Database Update. Nucleic Acids Res. 2021, doi: 10.1093/nar/gkab944 | Contact: Lukasz P. Kozlowski |
