Kocuria palustris PEL
Taxonomy: cellular organisms; Bacteria; Terrabacteria group; Actinobacteria; Actinomycetia; Micrococcales; Micrococcaceae; Kocuria; Kocuria palustris
Average proteome isoelectric point is 5.93
Get precalculated fractions of proteins

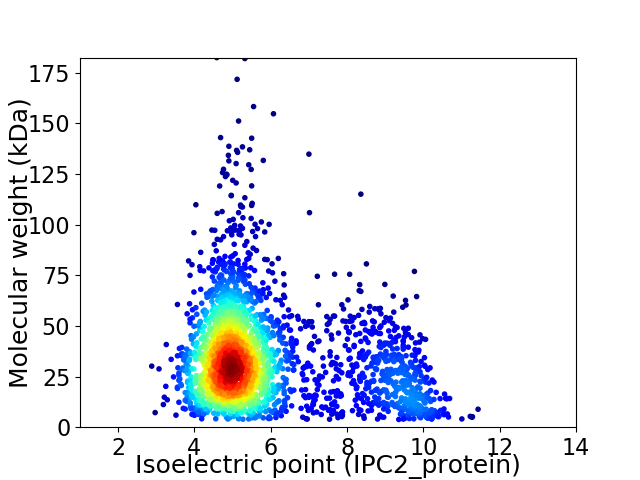
Virtual 2D-PAGE plot for 2561 proteins (isoelectric point calculated using IPC2_protein)
Get csv file with sequences according to given criteria:
* You can choose from 21 different methods for calculating isoelectric point
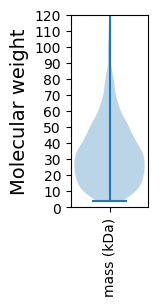
Summary statistics related to proteome-wise predictions


Protein with the lowest isoelectric point:
>tr|M2XFH2|M2XFH2_9MICC Probable cell division protein WhiA OS=Kocuria palustris PEL OX=1236550 GN=whiA PE=3 SV=1
MM1 pKa = 7.08KK2 pKa = 10.14ASRR5 pKa = 11.84IGQSAAILSIGAIALTACGGGGTTTLQGAGASSQEE40 pKa = 3.82AAMNAWSDD48 pKa = 3.77GAGEE52 pKa = 4.72LDD54 pKa = 3.6PAVEE58 pKa = 4.18VRR60 pKa = 11.84YY61 pKa = 10.7SPDD64 pKa = 2.76GSGAGRR70 pKa = 11.84EE71 pKa = 3.98AFLAGGASFAGSDD84 pKa = 3.04AAMDD88 pKa = 3.73EE89 pKa = 4.61EE90 pKa = 4.59EE91 pKa = 4.52FEE93 pKa = 4.58SSKK96 pKa = 9.99EE97 pKa = 3.84QCGDD101 pKa = 2.86KK102 pKa = 11.12GAFNVPAYY110 pKa = 9.57ISPIAVGFNLEE121 pKa = 5.02GIDD124 pKa = 4.8SLNLDD129 pKa = 4.06AEE131 pKa = 4.7TIAGIFSGEE140 pKa = 3.54ITTWNDD146 pKa = 2.97PAIAQQNPDD155 pKa = 3.76ADD157 pKa = 4.42LPDD160 pKa = 3.71TNITVVHH167 pKa = 6.74RR168 pKa = 11.84SDD170 pKa = 3.92EE171 pKa = 4.41SGTTEE176 pKa = 3.9NFTDD180 pKa = 4.14YY181 pKa = 11.05LHH183 pKa = 7.17AAAPEE188 pKa = 3.97AWSDD192 pKa = 3.7EE193 pKa = 4.22ASEE196 pKa = 4.28SWPISGQEE204 pKa = 3.96NSQGTSGVVSTASDD218 pKa = 3.29TDD220 pKa = 3.79GAITYY225 pKa = 10.25ADD227 pKa = 3.41ASAIGDD233 pKa = 4.16LGTVAVGVGDD243 pKa = 4.86DD244 pKa = 3.8YY245 pKa = 12.18VEE247 pKa = 4.22YY248 pKa = 11.08SPDD251 pKa = 3.18AAAAAVDD258 pKa = 3.66ASQRR262 pKa = 11.84VEE264 pKa = 4.76GGAEE268 pKa = 3.69NNMALEE274 pKa = 4.57LDD276 pKa = 4.19RR277 pKa = 11.84DD278 pKa = 4.16TEE280 pKa = 4.31ADD282 pKa = 3.19GAYY285 pKa = 9.73PIILVSYY292 pKa = 9.89HH293 pKa = 6.82IYY295 pKa = 10.27CNEE298 pKa = 3.9YY299 pKa = 10.2QDD301 pKa = 5.15QDD303 pKa = 3.56TADD306 pKa = 3.33AAKK309 pKa = 10.76AFGQYY314 pKa = 9.14VVSEE318 pKa = 4.39EE319 pKa = 4.25GQQASADD326 pKa = 3.97AAHH329 pKa = 6.55SAPLSEE335 pKa = 4.83KK336 pKa = 9.48MRR338 pKa = 11.84QEE340 pKa = 3.45AHH342 pKa = 6.94DD343 pKa = 5.57AIDD346 pKa = 3.58QITAAGG352 pKa = 3.45
MM1 pKa = 7.08KK2 pKa = 10.14ASRR5 pKa = 11.84IGQSAAILSIGAIALTACGGGGTTTLQGAGASSQEE40 pKa = 3.82AAMNAWSDD48 pKa = 3.77GAGEE52 pKa = 4.72LDD54 pKa = 3.6PAVEE58 pKa = 4.18VRR60 pKa = 11.84YY61 pKa = 10.7SPDD64 pKa = 2.76GSGAGRR70 pKa = 11.84EE71 pKa = 3.98AFLAGGASFAGSDD84 pKa = 3.04AAMDD88 pKa = 3.73EE89 pKa = 4.61EE90 pKa = 4.59EE91 pKa = 4.52FEE93 pKa = 4.58SSKK96 pKa = 9.99EE97 pKa = 3.84QCGDD101 pKa = 2.86KK102 pKa = 11.12GAFNVPAYY110 pKa = 9.57ISPIAVGFNLEE121 pKa = 5.02GIDD124 pKa = 4.8SLNLDD129 pKa = 4.06AEE131 pKa = 4.7TIAGIFSGEE140 pKa = 3.54ITTWNDD146 pKa = 2.97PAIAQQNPDD155 pKa = 3.76ADD157 pKa = 4.42LPDD160 pKa = 3.71TNITVVHH167 pKa = 6.74RR168 pKa = 11.84SDD170 pKa = 3.92EE171 pKa = 4.41SGTTEE176 pKa = 3.9NFTDD180 pKa = 4.14YY181 pKa = 11.05LHH183 pKa = 7.17AAAPEE188 pKa = 3.97AWSDD192 pKa = 3.7EE193 pKa = 4.22ASEE196 pKa = 4.28SWPISGQEE204 pKa = 3.96NSQGTSGVVSTASDD218 pKa = 3.29TDD220 pKa = 3.79GAITYY225 pKa = 10.25ADD227 pKa = 3.41ASAIGDD233 pKa = 4.16LGTVAVGVGDD243 pKa = 4.86DD244 pKa = 3.8YY245 pKa = 12.18VEE247 pKa = 4.22YY248 pKa = 11.08SPDD251 pKa = 3.18AAAAAVDD258 pKa = 3.66ASQRR262 pKa = 11.84VEE264 pKa = 4.76GGAEE268 pKa = 3.69NNMALEE274 pKa = 4.57LDD276 pKa = 4.19RR277 pKa = 11.84DD278 pKa = 4.16TEE280 pKa = 4.31ADD282 pKa = 3.19GAYY285 pKa = 9.73PIILVSYY292 pKa = 9.89HH293 pKa = 6.82IYY295 pKa = 10.27CNEE298 pKa = 3.9YY299 pKa = 10.2QDD301 pKa = 5.15QDD303 pKa = 3.56TADD306 pKa = 3.33AAKK309 pKa = 10.76AFGQYY314 pKa = 9.14VVSEE318 pKa = 4.39EE319 pKa = 4.25GQQASADD326 pKa = 3.97AAHH329 pKa = 6.55SAPLSEE335 pKa = 4.83KK336 pKa = 9.48MRR338 pKa = 11.84QEE340 pKa = 3.45AHH342 pKa = 6.94DD343 pKa = 5.57AIDD346 pKa = 3.58QITAAGG352 pKa = 3.45
Molecular weight: 36.06 kDa
Isoelectric point according different methods:
Protein with the highest isoelectric point:
>tr|M2XD66|M2XD66_9MICC Regulatory protein ArsR family OS=Kocuria palustris PEL OX=1236550 GN=C884_02162 PE=4 SV=1
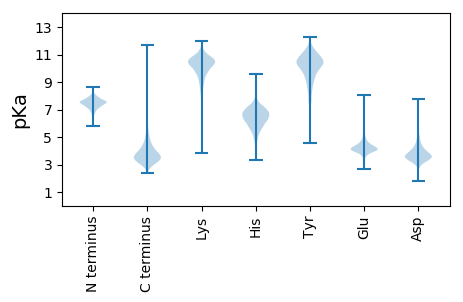
MM1 pKa = 7.69SKK3 pKa = 9.0RR4 pKa = 11.84TFQPNNRR11 pKa = 11.84RR12 pKa = 11.84RR13 pKa = 11.84AKK15 pKa = 10.04KK16 pKa = 8.86HH17 pKa = 4.36GFRR20 pKa = 11.84ARR22 pKa = 11.84MRR24 pKa = 11.84TRR26 pKa = 11.84AGRR29 pKa = 11.84GILSARR35 pKa = 11.84RR36 pKa = 11.84AKK38 pKa = 10.38GRR40 pKa = 11.84ASLSAA45 pKa = 3.83
MM1 pKa = 7.69SKK3 pKa = 9.0RR4 pKa = 11.84TFQPNNRR11 pKa = 11.84RR12 pKa = 11.84RR13 pKa = 11.84AKK15 pKa = 10.04KK16 pKa = 8.86HH17 pKa = 4.36GFRR20 pKa = 11.84ARR22 pKa = 11.84MRR24 pKa = 11.84TRR26 pKa = 11.84AGRR29 pKa = 11.84GILSARR35 pKa = 11.84RR36 pKa = 11.84AKK38 pKa = 10.38GRR40 pKa = 11.84ASLSAA45 pKa = 3.83
Molecular weight: 5.17 kDa
Isoelectric point according different methods:
Peptides (in silico digests for buttom-up proteomics)
Below you can find in silico digests of the whole proteome with Trypsin, Chymotrypsin, Trypsin+LysC, LysN, ArgC proteases suitable for different mass spec machines.| Try ESI |
 |
|---|
| ChTry ESI |
 |
|---|
| ArgC ESI |
 |
|---|
| LysN ESI |
 |
|---|
| TryLysC ESI |
 |
|---|
| Try MALDI |
 |
|---|
| ChTry MALDI |
 |
|---|
| ArgC MALDI |
 |
|---|
| LysN MALDI |
 |
|---|
| TryLysC MALDI |
 |
|---|
| Try LTQ |
 |
|---|
| ChTry LTQ |
 |
|---|
| ArgC LTQ |
 |
|---|
| LysN LTQ |
 |
|---|
| TryLysC LTQ |
 |
|---|
| Try MSlow |
 |
|---|
| ChTry MSlow |
 |
|---|
| ArgC MSlow |
 |
|---|
| LysN MSlow |
 |
|---|
| TryLysC MSlow |
 |
|---|
| Try MShigh |
 |
|---|
| ChTry MShigh |
 |
|---|
| ArgC MShigh |
 |
|---|
| LysN MShigh |
 |
|---|
| TryLysC MShigh |
 |
|---|
General Statistics
Number of major isoforms |
Number of additional isoforms |
Number of all proteins |
Number of amino acids |
Min. Seq. Length |
Max. Seq. Length |
Avg. Seq. Length |
Avg. Mol. Weight |
|---|---|---|---|---|---|---|---|
0 |
840818 |
37 |
1693 |
328.3 |
35.34 |
Amino acid frequency
Ala |
Cys |
Asp |
Glu |
Phe |
Gly |
His |
Ile |
Lys |
Leu |
|---|---|---|---|---|---|---|---|---|---|
12.598 ± 0.068 | 0.632 ± 0.012 |
6.191 ± 0.043 | 6.66 ± 0.049 |
2.787 ± 0.031 | 9.013 ± 0.045 |
2.163 ± 0.023 | 4.119 ± 0.035 |
1.912 ± 0.035 | 10.099 ± 0.056 |
Met |
Asn |
Gln |
Pro |
Arg |
Ser |
Thr |
Val |
Trp |
Tyr |
|---|---|---|---|---|---|---|---|---|---|
2.157 ± 0.021 | 1.667 ± 0.022 |
5.568 ± 0.037 | 3.752 ± 0.028 |
7.624 ± 0.053 | 6.182 ± 0.035 |
5.487 ± 0.03 | 8.15 ± 0.041 |
1.479 ± 0.019 | 1.759 ± 0.022 |
Most of the basic statistics you can see at this page can be downloaded from this CSV file
Proteome-pI is available under Creative Commons Attribution-NoDerivs license, for more details see here
| Reference: Kozlowski LP. Proteome-pI 2.0: Proteome Isoelectric Point Database Update. Nucleic Acids Res. 2021, doi: 10.1093/nar/gkab944 | Contact: Lukasz P. Kozlowski |
