Arthrobacter phage Ingrid
Taxonomy: Viruses; Duplodnaviria; Heunggongvirae; Uroviricota; Caudoviricetes; Caudovirales; Siphoviridae; Gordonvirus; unclassified Gordonvirus
Average proteome isoelectric point is 6.84
Get precalculated fractions of proteins

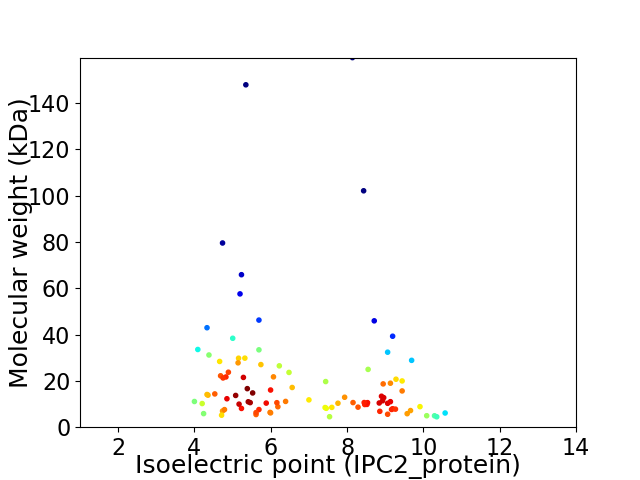
Virtual 2D-PAGE plot for 95 proteins (isoelectric point calculated using IPC2_protein)
Get csv file with sequences according to given criteria:
* You can choose from 21 different methods for calculating isoelectric point
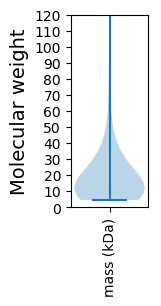
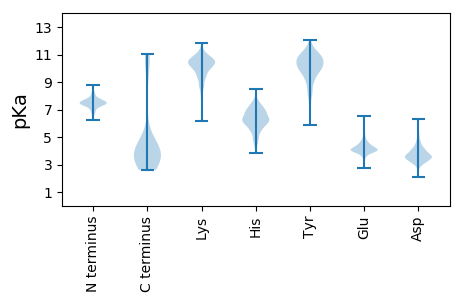
Summary statistics related to proteome-wise predictions


Protein with the lowest isoelectric point:
>tr|A0A5J6TG02|A0A5J6TG02_9CAUD Uncharacterized protein OS=Arthrobacter phage Ingrid OX=2599825 GN=24 PE=4 SV=1
MM1 pKa = 6.71GTLYY5 pKa = 10.55EE6 pKa = 4.92DD7 pKa = 4.34PNDD10 pKa = 4.03PGTYY14 pKa = 10.03LIQSTPSTPSDD25 pKa = 3.34PGGGYY30 pKa = 10.63DD31 pKa = 3.44PTRR34 pKa = 11.84PTDD37 pKa = 3.71LRR39 pKa = 11.84PTKK42 pKa = 9.65LTWGTLGEE50 pKa = 4.17RR51 pKa = 11.84FYY53 pKa = 11.33EE54 pKa = 4.49AGTDD58 pKa = 3.3RR59 pKa = 11.84GVLYY63 pKa = 10.99VDD65 pKa = 3.72GVGYY69 pKa = 10.6AWNGLVSVNQTPSGGEE85 pKa = 3.78PEE87 pKa = 4.77PYY89 pKa = 10.11YY90 pKa = 10.91LDD92 pKa = 4.59GIPYY96 pKa = 10.03VMAASPEE103 pKa = 4.09EE104 pKa = 3.97FKK106 pKa = 11.37GSIEE110 pKa = 4.24AYY112 pKa = 7.97TYY114 pKa = 10.16PKK116 pKa = 10.65AFEE119 pKa = 4.51ACDD122 pKa = 3.67GSEE125 pKa = 4.47EE126 pKa = 4.2IAQGLYY132 pKa = 9.99ISQQNRR138 pKa = 11.84KK139 pKa = 8.69PFGFSYY145 pKa = 9.32RR146 pKa = 11.84TLVGNDD152 pKa = 2.91IDD154 pKa = 4.71EE155 pKa = 4.98LDD157 pKa = 3.59HH158 pKa = 6.63GYY160 pKa = 10.12KK161 pKa = 9.98VHH163 pKa = 6.84IVYY166 pKa = 10.26EE167 pKa = 4.48AMASPSNRR175 pKa = 11.84NHH177 pKa = 5.93GTLGDD182 pKa = 3.9NTDD185 pKa = 3.36PTTFSWNIITKK196 pKa = 8.86PVKK199 pKa = 10.64FEE201 pKa = 4.63DD202 pKa = 3.55PAFGIKK208 pKa = 10.13YY209 pKa = 9.38GAHH212 pKa = 5.95LTLDD216 pKa = 3.52SRR218 pKa = 11.84EE219 pKa = 4.11VYY221 pKa = 8.57PWAMAAVEE229 pKa = 4.08DD230 pKa = 4.13VLYY233 pKa = 8.91GTEE236 pKa = 4.04DD237 pKa = 3.53TEE239 pKa = 4.49PRR241 pKa = 11.84LPTPQEE247 pKa = 3.65IVALFADD254 pKa = 3.82NALLKK259 pKa = 9.82ITDD262 pKa = 4.11NGDD265 pKa = 3.66GTWTAEE271 pKa = 4.3GPDD274 pKa = 4.55SIISMIDD281 pKa = 2.94ANTFQIDD288 pKa = 3.67WPSAVYY294 pKa = 10.57LDD296 pKa = 3.9EE297 pKa = 3.96NTYY300 pKa = 10.9NVSSLL305 pKa = 3.48
MM1 pKa = 6.71GTLYY5 pKa = 10.55EE6 pKa = 4.92DD7 pKa = 4.34PNDD10 pKa = 4.03PGTYY14 pKa = 10.03LIQSTPSTPSDD25 pKa = 3.34PGGGYY30 pKa = 10.63DD31 pKa = 3.44PTRR34 pKa = 11.84PTDD37 pKa = 3.71LRR39 pKa = 11.84PTKK42 pKa = 9.65LTWGTLGEE50 pKa = 4.17RR51 pKa = 11.84FYY53 pKa = 11.33EE54 pKa = 4.49AGTDD58 pKa = 3.3RR59 pKa = 11.84GVLYY63 pKa = 10.99VDD65 pKa = 3.72GVGYY69 pKa = 10.6AWNGLVSVNQTPSGGEE85 pKa = 3.78PEE87 pKa = 4.77PYY89 pKa = 10.11YY90 pKa = 10.91LDD92 pKa = 4.59GIPYY96 pKa = 10.03VMAASPEE103 pKa = 4.09EE104 pKa = 3.97FKK106 pKa = 11.37GSIEE110 pKa = 4.24AYY112 pKa = 7.97TYY114 pKa = 10.16PKK116 pKa = 10.65AFEE119 pKa = 4.51ACDD122 pKa = 3.67GSEE125 pKa = 4.47EE126 pKa = 4.2IAQGLYY132 pKa = 9.99ISQQNRR138 pKa = 11.84KK139 pKa = 8.69PFGFSYY145 pKa = 9.32RR146 pKa = 11.84TLVGNDD152 pKa = 2.91IDD154 pKa = 4.71EE155 pKa = 4.98LDD157 pKa = 3.59HH158 pKa = 6.63GYY160 pKa = 10.12KK161 pKa = 9.98VHH163 pKa = 6.84IVYY166 pKa = 10.26EE167 pKa = 4.48AMASPSNRR175 pKa = 11.84NHH177 pKa = 5.93GTLGDD182 pKa = 3.9NTDD185 pKa = 3.36PTTFSWNIITKK196 pKa = 8.86PVKK199 pKa = 10.64FEE201 pKa = 4.63DD202 pKa = 3.55PAFGIKK208 pKa = 10.13YY209 pKa = 9.38GAHH212 pKa = 5.95LTLDD216 pKa = 3.52SRR218 pKa = 11.84EE219 pKa = 4.11VYY221 pKa = 8.57PWAMAAVEE229 pKa = 4.08DD230 pKa = 4.13VLYY233 pKa = 8.91GTEE236 pKa = 4.04DD237 pKa = 3.53TEE239 pKa = 4.49PRR241 pKa = 11.84LPTPQEE247 pKa = 3.65IVALFADD254 pKa = 3.82NALLKK259 pKa = 9.82ITDD262 pKa = 4.11NGDD265 pKa = 3.66GTWTAEE271 pKa = 4.3GPDD274 pKa = 4.55SIISMIDD281 pKa = 2.94ANTFQIDD288 pKa = 3.67WPSAVYY294 pKa = 10.57LDD296 pKa = 3.9EE297 pKa = 3.96NTYY300 pKa = 10.9NVSSLL305 pKa = 3.48
Molecular weight: 33.55 kDa
Isoelectric point according different methods:
Protein with the highest isoelectric point:
>tr|A0A5J6TEI5|A0A5J6TEI5_9CAUD Uncharacterized protein OS=Arthrobacter phage Ingrid OX=2599825 GN=72 PE=4 SV=1
MM1 pKa = 7.56KK2 pKa = 10.2NLKK5 pKa = 9.96RR6 pKa = 11.84FAWLLRR12 pKa = 11.84MTPWVFKK19 pKa = 10.37HH20 pKa = 6.46AYY22 pKa = 8.13HH23 pKa = 7.31APNHH27 pKa = 5.18QVNGSSIEE35 pKa = 4.0KK36 pKa = 10.38NFVLGYY42 pKa = 8.13FRR44 pKa = 11.84CRR46 pKa = 11.84RR47 pKa = 11.84CQEE50 pKa = 4.08TLTVPSYY57 pKa = 11.03ISNN60 pKa = 3.7
MM1 pKa = 7.56KK2 pKa = 10.2NLKK5 pKa = 9.96RR6 pKa = 11.84FAWLLRR12 pKa = 11.84MTPWVFKK19 pKa = 10.37HH20 pKa = 6.46AYY22 pKa = 8.13HH23 pKa = 7.31APNHH27 pKa = 5.18QVNGSSIEE35 pKa = 4.0KK36 pKa = 10.38NFVLGYY42 pKa = 8.13FRR44 pKa = 11.84CRR46 pKa = 11.84RR47 pKa = 11.84CQEE50 pKa = 4.08TLTVPSYY57 pKa = 11.03ISNN60 pKa = 3.7
Molecular weight: 7.19 kDa
Isoelectric point according different methods:
Peptides (in silico digests for buttom-up proteomics)
Below you can find in silico digests of the whole proteome with Trypsin, Chymotrypsin, Trypsin+LysC, LysN, ArgC proteases suitable for different mass spec machines.| Try ESI |
 |
|---|
| ChTry ESI |
 |
|---|
| ArgC ESI |
 |
|---|
| LysN ESI |
 |
|---|
| TryLysC ESI |
 |
|---|
| Try MALDI |
 |
|---|
| ChTry MALDI |
 |
|---|
| ArgC MALDI |
 |
|---|
| LysN MALDI |
 |
|---|
| TryLysC MALDI |
 |
|---|
| Try LTQ |
 |
|---|
| ChTry LTQ |
 |
|---|
| ArgC LTQ |
 |
|---|
| LysN LTQ |
 |
|---|
| TryLysC LTQ |
 |
|---|
| Try MSlow |
 |
|---|
| ChTry MSlow |
 |
|---|
| ArgC MSlow |
 |
|---|
| LysN MSlow |
 |
|---|
| TryLysC MSlow |
 |
|---|
| Try MShigh |
 |
|---|
| ChTry MShigh |
 |
|---|
| ArgC MShigh |
 |
|---|
| LysN MShigh |
 |
|---|
| TryLysC MShigh |
 |
|---|
General Statistics
Number of major isoforms |
Number of additional isoforms |
Number of all proteins |
Number of amino acids |
Min. Seq. Length |
Max. Seq. Length |
Avg. Seq. Length |
Avg. Mol. Weight |
|---|---|---|---|---|---|---|---|
0 |
18135 |
38 |
1528 |
190.9 |
21.19 |
Amino acid frequency
Ala |
Cys |
Asp |
Glu |
Phe |
Gly |
His |
Ile |
Lys |
Leu |
|---|---|---|---|---|---|---|---|---|---|
8.839 ± 0.471 | 0.612 ± 0.102 |
5.729 ± 0.316 | 6.479 ± 0.372 |
3.794 ± 0.177 | 7.588 ± 0.527 |
1.908 ± 0.196 | 5.961 ± 0.221 |
6.573 ± 0.411 | 7.825 ± 0.372 |
Met |
Asn |
Gln |
Pro |
Arg |
Ser |
Thr |
Val |
Trp |
Tyr |
|---|---|---|---|---|---|---|---|---|---|
3.093 ± 0.214 | 4.808 ± 0.151 |
4.119 ± 0.247 | 3.309 ± 0.112 |
4.968 ± 0.281 | 6.369 ± 0.237 |
6.248 ± 0.255 | 6.964 ± 0.221 |
1.467 ± 0.131 | 3.347 ± 0.266 |
Most of the basic statistics you can see at this page can be downloaded from this CSV file
Proteome-pI is available under Creative Commons Attribution-NoDerivs license, for more details see here
| Reference: Kozlowski LP. Proteome-pI 2.0: Proteome Isoelectric Point Database Update. Nucleic Acids Res. 2021, doi: 10.1093/nar/gkab944 | Contact: Lukasz P. Kozlowski |
