Phycisphaera mikurensis (strain NBRC 102666 / KCTC 22515 / FYK2301M01)
Taxonomy: cellular organisms; Bacteria; PVC group; Planctomycetes; Phycisphaerae; Phycisphaerales; Phycisphaeraceae; Phycisphaera; Phycisphaera mikurensis
Average proteome isoelectric point is 6.47
Get precalculated fractions of proteins

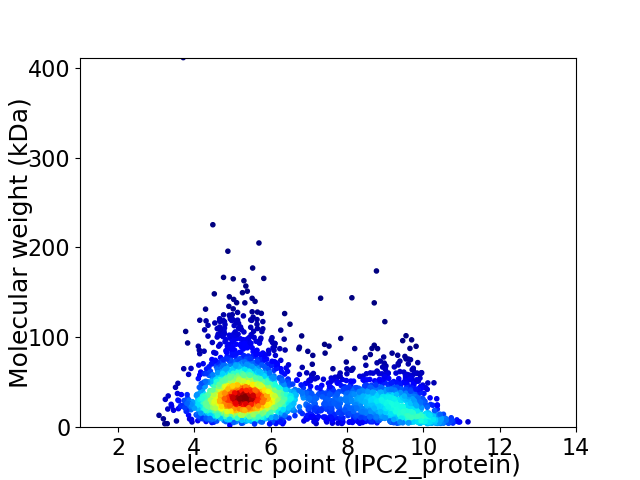
Virtual 2D-PAGE plot for 3269 proteins (isoelectric point calculated using IPC2_protein)
Get csv file with sequences according to given criteria:
* You can choose from 21 different methods for calculating isoelectric point
Summary statistics related to proteome-wise predictions


Protein with the lowest isoelectric point:
>tr|I0IDX7|I0IDX7_PHYMF N-acetylmuramoyl-L-alanine amidase domain-containing protein OS=Phycisphaera mikurensis (strain NBRC 102666 / KCTC 22515 / FYK2301M01) OX=1142394 GN=PSMK_13060 PE=4 SV=1
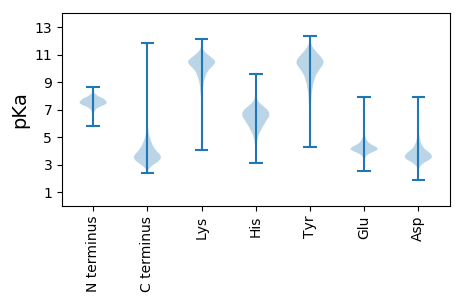
MM1 pKa = 8.0VIEE4 pKa = 5.41DD5 pKa = 3.73FAEE8 pKa = 4.49FNPTTQVVDD17 pKa = 3.63PSFGIFRR24 pKa = 11.84SGVGPAGSGSNGGAVSGTTAISSTPWDD51 pKa = 3.79FTPGGGTSYY60 pKa = 11.53VNNLSITDD68 pKa = 3.84DD69 pKa = 3.66NLFGGGLNYY78 pKa = 10.23GVPTAWTLRR87 pKa = 11.84HH88 pKa = 5.87IANGGAPSAANLVSAAGGVGSVGFYY113 pKa = 10.95LQTTSPDD120 pKa = 3.14LSVRR124 pKa = 11.84IALDD128 pKa = 3.32EE129 pKa = 4.42TGGSGGTEE137 pKa = 3.61GSVAQDD143 pKa = 3.38VIADD147 pKa = 4.25GEE149 pKa = 4.39YY150 pKa = 10.67HH151 pKa = 7.31LYY153 pKa = 9.45QWSLADD159 pKa = 3.55AAQWNPLFGASNGEE173 pKa = 4.04LDD175 pKa = 3.51GTTYY179 pKa = 10.56TIDD182 pKa = 3.59SIVFYY187 pKa = 11.0DD188 pKa = 5.03LGAEE192 pKa = 4.45DD193 pKa = 5.73GSTSDD198 pKa = 4.13FNLAYY203 pKa = 10.36VVADD207 pKa = 3.39NTGPLVNVVPEE218 pKa = 4.2PVGLLALGLAGFGLLGRR235 pKa = 11.84RR236 pKa = 11.84RR237 pKa = 11.84AGG239 pKa = 3.13
MM1 pKa = 8.0VIEE4 pKa = 5.41DD5 pKa = 3.73FAEE8 pKa = 4.49FNPTTQVVDD17 pKa = 3.63PSFGIFRR24 pKa = 11.84SGVGPAGSGSNGGAVSGTTAISSTPWDD51 pKa = 3.79FTPGGGTSYY60 pKa = 11.53VNNLSITDD68 pKa = 3.84DD69 pKa = 3.66NLFGGGLNYY78 pKa = 10.23GVPTAWTLRR87 pKa = 11.84HH88 pKa = 5.87IANGGAPSAANLVSAAGGVGSVGFYY113 pKa = 10.95LQTTSPDD120 pKa = 3.14LSVRR124 pKa = 11.84IALDD128 pKa = 3.32EE129 pKa = 4.42TGGSGGTEE137 pKa = 3.61GSVAQDD143 pKa = 3.38VIADD147 pKa = 4.25GEE149 pKa = 4.39YY150 pKa = 10.67HH151 pKa = 7.31LYY153 pKa = 9.45QWSLADD159 pKa = 3.55AAQWNPLFGASNGEE173 pKa = 4.04LDD175 pKa = 3.51GTTYY179 pKa = 10.56TIDD182 pKa = 3.59SIVFYY187 pKa = 11.0DD188 pKa = 5.03LGAEE192 pKa = 4.45DD193 pKa = 5.73GSTSDD198 pKa = 4.13FNLAYY203 pKa = 10.36VVADD207 pKa = 3.39NTGPLVNVVPEE218 pKa = 4.2PVGLLALGLAGFGLLGRR235 pKa = 11.84RR236 pKa = 11.84RR237 pKa = 11.84AGG239 pKa = 3.13
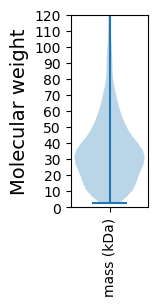
Molecular weight: 24.25 kDa
Isoelectric point according different methods:
Protein with the highest isoelectric point:
>tr|I0IGW5|I0IGW5_PHYMF Beta-glucosidase OS=Phycisphaera mikurensis (strain NBRC 102666 / KCTC 22515 / FYK2301M01) OX=1142394 GN=PSMK_23440 PE=3 SV=1
MM1 pKa = 6.78STHH4 pKa = 4.92YY5 pKa = 9.93PKK7 pKa = 10.36RR8 pKa = 11.84RR9 pKa = 11.84SLIKK13 pKa = 9.9RR14 pKa = 11.84ARR16 pKa = 11.84KK17 pKa = 8.72FGFRR21 pKa = 11.84ARR23 pKa = 11.84MKK25 pKa = 9.71TSLGRR30 pKa = 11.84KK31 pKa = 5.67MLNRR35 pKa = 11.84KK36 pKa = 8.95RR37 pKa = 11.84RR38 pKa = 11.84VGRR41 pKa = 11.84SVNVRR46 pKa = 11.84KK47 pKa = 10.45SFF49 pKa = 3.35
MM1 pKa = 6.78STHH4 pKa = 4.92YY5 pKa = 9.93PKK7 pKa = 10.36RR8 pKa = 11.84RR9 pKa = 11.84SLIKK13 pKa = 9.9RR14 pKa = 11.84ARR16 pKa = 11.84KK17 pKa = 8.72FGFRR21 pKa = 11.84ARR23 pKa = 11.84MKK25 pKa = 9.71TSLGRR30 pKa = 11.84KK31 pKa = 5.67MLNRR35 pKa = 11.84KK36 pKa = 8.95RR37 pKa = 11.84RR38 pKa = 11.84VGRR41 pKa = 11.84SVNVRR46 pKa = 11.84KK47 pKa = 10.45SFF49 pKa = 3.35
Molecular weight: 5.95 kDa
Isoelectric point according different methods:
Peptides (in silico digests for buttom-up proteomics)
Below you can find in silico digests of the whole proteome with Trypsin, Chymotrypsin, Trypsin+LysC, LysN, ArgC proteases suitable for different mass spec machines.| Try ESI |
 |
|---|
| ChTry ESI |
 |
|---|
| ArgC ESI |
 |
|---|
| LysN ESI |
 |
|---|
| TryLysC ESI |
 |
|---|
| Try MALDI |
 |
|---|
| ChTry MALDI |
 |
|---|
| ArgC MALDI |
 |
|---|
| LysN MALDI |
 |
|---|
| TryLysC MALDI |
 |
|---|
| Try LTQ |
 |
|---|
| ChTry LTQ |
 |
|---|
| ArgC LTQ |
 |
|---|
| LysN LTQ |
 |
|---|
| TryLysC LTQ |
 |
|---|
| Try MSlow |
 |
|---|
| ChTry MSlow |
 |
|---|
| ArgC MSlow |
 |
|---|
| LysN MSlow |
 |
|---|
| TryLysC MSlow |
 |
|---|
| Try MShigh |
 |
|---|
| ChTry MShigh |
 |
|---|
| ArgC MShigh |
 |
|---|
| LysN MShigh |
 |
|---|
| TryLysC MShigh |
 |
|---|
General Statistics
Number of major isoforms |
Number of additional isoforms |
Number of all proteins |
Number of amino acids |
Min. Seq. Length |
Max. Seq. Length |
Avg. Seq. Length |
Avg. Mol. Weight |
|---|---|---|---|---|---|---|---|
0 |
1143530 |
24 |
4118 |
349.8 |
37.29 |
Amino acid frequency
Ala |
Cys |
Asp |
Glu |
Phe |
Gly |
His |
Ile |
Lys |
Leu |
|---|---|---|---|---|---|---|---|---|---|
14.799 ± 0.086 | 0.893 ± 0.016 |
6.042 ± 0.035 | 6.014 ± 0.041 |
3.261 ± 0.029 | 9.88 ± 0.039 |
2.147 ± 0.024 | 3.035 ± 0.027 |
2.137 ± 0.034 | 10.46 ± 0.053 |
Met |
Asn |
Gln |
Pro |
Arg |
Ser |
Thr |
Val |
Trp |
Tyr |
|---|---|---|---|---|---|---|---|---|---|
1.761 ± 0.019 | 1.937 ± 0.023 |
6.415 ± 0.038 | 2.425 ± 0.023 |
8.319 ± 0.051 | 4.72 ± 0.026 |
4.902 ± 0.034 | 7.751 ± 0.039 |
1.403 ± 0.021 | 1.702 ± 0.021 |
Most of the basic statistics you can see at this page can be downloaded from this CSV file
Proteome-pI is available under Creative Commons Attribution-NoDerivs license, for more details see here
| Reference: Kozlowski LP. Proteome-pI 2.0: Proteome Isoelectric Point Database Update. Nucleic Acids Res. 2021, doi: 10.1093/nar/gkab944 | Contact: Lukasz P. Kozlowski |
