Spiribacter salinus M19-40
Taxonomy: cellular organisms; Bacteria; Proteobacteria; Gammaproteobacteria; Chromatiales; Ectothiorhodospiraceae; Spiribacter; Spiribacter salinus
Average proteome isoelectric point is 5.94
Get precalculated fractions of proteins

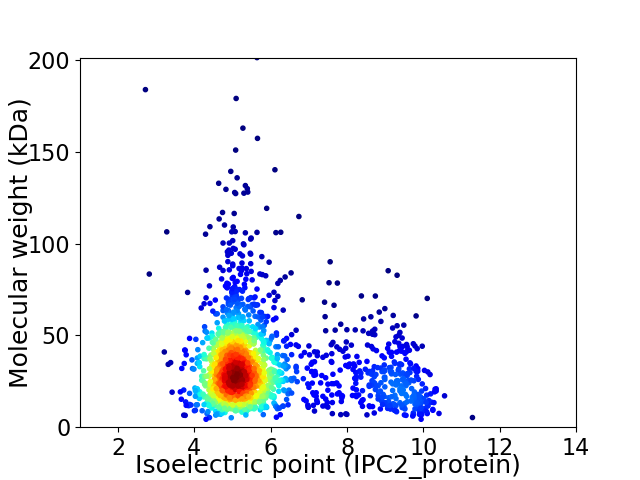
Virtual 2D-PAGE plot for 1684 proteins (isoelectric point calculated using IPC2_protein)
Get csv file with sequences according to given criteria:
* You can choose from 21 different methods for calculating isoelectric point
Summary statistics related to proteome-wise predictions


Protein with the lowest isoelectric point:
>tr|R4V728|R4V728_9GAMM GMP synthase OS=Spiribacter salinus M19-40 OX=1260251 GN=SPISAL_03580 PE=4 SV=1
MM1 pKa = 7.07TARR4 pKa = 11.84IACRR8 pKa = 11.84CFMLLSLLVPLASVSAEE25 pKa = 4.16DD26 pKa = 5.31ADD28 pKa = 4.28TLYY31 pKa = 11.19LFNWSQYY38 pKa = 8.02MDD40 pKa = 4.07PSIIEE45 pKa = 3.97AFEE48 pKa = 4.46AEE50 pKa = 4.37HH51 pKa = 5.72EE52 pKa = 4.53VEE54 pKa = 4.45VVEE57 pKa = 6.4NYY59 pKa = 10.12FNSNGEE65 pKa = 4.25MFSKK69 pKa = 10.45LQAGGVSQYY78 pKa = 11.69DD79 pKa = 3.32VVVPSNYY86 pKa = 9.53YY87 pKa = 9.21VPRR90 pKa = 11.84LIEE93 pKa = 4.07SDD95 pKa = 3.36LVQRR99 pKa = 11.84LDD101 pKa = 3.27KK102 pKa = 11.25AQIPNLDD109 pKa = 3.43NLMEE113 pKa = 4.22TFIDD117 pKa = 3.89PAYY120 pKa = 10.76DD121 pKa = 3.69PGNDD125 pKa = 3.17YY126 pKa = 11.1SAAYY130 pKa = 8.97QWGTTGLVYY139 pKa = 10.62DD140 pKa = 4.99RR141 pKa = 11.84SALGEE146 pKa = 4.16QPASWSVLFDD156 pKa = 4.26PDD158 pKa = 4.14VNPDD162 pKa = 3.15APFAVPEE169 pKa = 4.74DD170 pKa = 3.97GQVTLGAACAYY181 pKa = 10.0LGHH184 pKa = 7.04GYY186 pKa = 10.67DD187 pKa = 3.72CTDD190 pKa = 3.28RR191 pKa = 11.84DD192 pKa = 4.15ALEE195 pKa = 3.96EE196 pKa = 3.91AARR199 pKa = 11.84LVLDD203 pKa = 4.65AKK205 pKa = 11.02ARR207 pKa = 11.84DD208 pKa = 3.65NFAGFIQGTPVLQQLVRR225 pKa = 11.84GSVSAGMTFNGDD237 pKa = 3.15YY238 pKa = 10.53FYY240 pKa = 11.29LKK242 pKa = 10.71EE243 pKa = 4.1EE244 pKa = 4.44DD245 pKa = 3.89PEE247 pKa = 4.43GFADD251 pKa = 3.69IEE253 pKa = 4.25FVIPEE258 pKa = 4.22EE259 pKa = 4.34GAEE262 pKa = 3.95IWVDD266 pKa = 3.13TMMIPADD273 pKa = 3.76APNPEE278 pKa = 4.39LAHH281 pKa = 6.53AFINFILDD289 pKa = 3.69AEE291 pKa = 4.65VGAQLSNWNYY301 pKa = 9.88YY302 pKa = 10.43SSPNAAALPLLNEE315 pKa = 4.35VLQAPPISPTDD326 pKa = 3.41EE327 pKa = 4.24TMEE330 pKa = 4.25TLAFTPSLMGDD341 pKa = 3.51EE342 pKa = 4.81LQFLQQIWRR351 pKa = 11.84EE352 pKa = 4.13VEE354 pKa = 4.0SRR356 pKa = 3.4
MM1 pKa = 7.07TARR4 pKa = 11.84IACRR8 pKa = 11.84CFMLLSLLVPLASVSAEE25 pKa = 4.16DD26 pKa = 5.31ADD28 pKa = 4.28TLYY31 pKa = 11.19LFNWSQYY38 pKa = 8.02MDD40 pKa = 4.07PSIIEE45 pKa = 3.97AFEE48 pKa = 4.46AEE50 pKa = 4.37HH51 pKa = 5.72EE52 pKa = 4.53VEE54 pKa = 4.45VVEE57 pKa = 6.4NYY59 pKa = 10.12FNSNGEE65 pKa = 4.25MFSKK69 pKa = 10.45LQAGGVSQYY78 pKa = 11.69DD79 pKa = 3.32VVVPSNYY86 pKa = 9.53YY87 pKa = 9.21VPRR90 pKa = 11.84LIEE93 pKa = 4.07SDD95 pKa = 3.36LVQRR99 pKa = 11.84LDD101 pKa = 3.27KK102 pKa = 11.25AQIPNLDD109 pKa = 3.43NLMEE113 pKa = 4.22TFIDD117 pKa = 3.89PAYY120 pKa = 10.76DD121 pKa = 3.69PGNDD125 pKa = 3.17YY126 pKa = 11.1SAAYY130 pKa = 8.97QWGTTGLVYY139 pKa = 10.62DD140 pKa = 4.99RR141 pKa = 11.84SALGEE146 pKa = 4.16QPASWSVLFDD156 pKa = 4.26PDD158 pKa = 4.14VNPDD162 pKa = 3.15APFAVPEE169 pKa = 4.74DD170 pKa = 3.97GQVTLGAACAYY181 pKa = 10.0LGHH184 pKa = 7.04GYY186 pKa = 10.67DD187 pKa = 3.72CTDD190 pKa = 3.28RR191 pKa = 11.84DD192 pKa = 4.15ALEE195 pKa = 3.96EE196 pKa = 3.91AARR199 pKa = 11.84LVLDD203 pKa = 4.65AKK205 pKa = 11.02ARR207 pKa = 11.84DD208 pKa = 3.65NFAGFIQGTPVLQQLVRR225 pKa = 11.84GSVSAGMTFNGDD237 pKa = 3.15YY238 pKa = 10.53FYY240 pKa = 11.29LKK242 pKa = 10.71EE243 pKa = 4.1EE244 pKa = 4.44DD245 pKa = 3.89PEE247 pKa = 4.43GFADD251 pKa = 3.69IEE253 pKa = 4.25FVIPEE258 pKa = 4.22EE259 pKa = 4.34GAEE262 pKa = 3.95IWVDD266 pKa = 3.13TMMIPADD273 pKa = 3.76APNPEE278 pKa = 4.39LAHH281 pKa = 6.53AFINFILDD289 pKa = 3.69AEE291 pKa = 4.65VGAQLSNWNYY301 pKa = 9.88YY302 pKa = 10.43SSPNAAALPLLNEE315 pKa = 4.35VLQAPPISPTDD326 pKa = 3.41EE327 pKa = 4.24TMEE330 pKa = 4.25TLAFTPSLMGDD341 pKa = 3.51EE342 pKa = 4.81LQFLQQIWRR351 pKa = 11.84EE352 pKa = 4.13VEE354 pKa = 4.0SRR356 pKa = 3.4
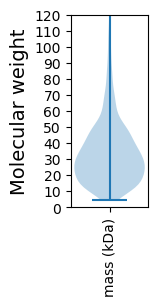
Molecular weight: 39.43 kDa
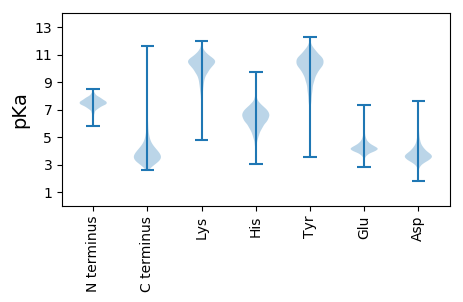
Isoelectric point according different methods:
Protein with the highest isoelectric point:
>tr|R4VCN4|R4VCN4_9GAMM Histidine kinase OS=Spiribacter salinus M19-40 OX=1260251 GN=SPISAL_00050 PE=4 SV=1
MM1 pKa = 7.45KK2 pKa = 9.51RR3 pKa = 11.84TFQPSVIKK11 pKa = 10.5RR12 pKa = 11.84KK13 pKa = 9.44RR14 pKa = 11.84NHH16 pKa = 5.44GFRR19 pKa = 11.84ARR21 pKa = 11.84MATRR25 pKa = 11.84NGRR28 pKa = 11.84KK29 pKa = 8.84VLARR33 pKa = 11.84RR34 pKa = 11.84RR35 pKa = 11.84AKK37 pKa = 10.53GRR39 pKa = 11.84VRR41 pKa = 11.84LTPP44 pKa = 3.82
MM1 pKa = 7.45KK2 pKa = 9.51RR3 pKa = 11.84TFQPSVIKK11 pKa = 10.5RR12 pKa = 11.84KK13 pKa = 9.44RR14 pKa = 11.84NHH16 pKa = 5.44GFRR19 pKa = 11.84ARR21 pKa = 11.84MATRR25 pKa = 11.84NGRR28 pKa = 11.84KK29 pKa = 8.84VLARR33 pKa = 11.84RR34 pKa = 11.84RR35 pKa = 11.84AKK37 pKa = 10.53GRR39 pKa = 11.84VRR41 pKa = 11.84LTPP44 pKa = 3.82
Molecular weight: 5.26 kDa
Isoelectric point according different methods:
Peptides (in silico digests for buttom-up proteomics)
Below you can find in silico digests of the whole proteome with Trypsin, Chymotrypsin, Trypsin+LysC, LysN, ArgC proteases suitable for different mass spec machines.| Try ESI |
 |
|---|
| ChTry ESI |
 |
|---|
| ArgC ESI |
 |
|---|
| LysN ESI |
 |
|---|
| TryLysC ESI |
 |
|---|
| Try MALDI |
 |
|---|
| ChTry MALDI |
 |
|---|
| ArgC MALDI |
 |
|---|
| LysN MALDI |
 |
|---|
| TryLysC MALDI |
 |
|---|
| Try LTQ |
 |
|---|
| ChTry LTQ |
 |
|---|
| ArgC LTQ |
 |
|---|
| LysN LTQ |
 |
|---|
| TryLysC LTQ |
 |
|---|
| Try MSlow |
 |
|---|
| ChTry MSlow |
 |
|---|
| ArgC MSlow |
 |
|---|
| LysN MSlow |
 |
|---|
| TryLysC MSlow |
 |
|---|
| Try MShigh |
 |
|---|
| ChTry MShigh |
 |
|---|
| ArgC MShigh |
 |
|---|
| LysN MShigh |
 |
|---|
| TryLysC MShigh |
 |
|---|
General Statistics
Number of major isoforms |
Number of additional isoforms |
Number of all proteins |
Number of amino acids |
Min. Seq. Length |
Max. Seq. Length |
Avg. Seq. Length |
Avg. Mol. Weight |
|---|---|---|---|---|---|---|---|
0 |
549060 |
38 |
1849 |
326.0 |
35.49 |
Amino acid frequency
Ala |
Cys |
Asp |
Glu |
Phe |
Gly |
His |
Ile |
Lys |
Leu |
|---|---|---|---|---|---|---|---|---|---|
12.233 ± 0.076 | 0.834 ± 0.019 |
6.069 ± 0.058 | 6.47 ± 0.064 |
3.205 ± 0.04 | 8.702 ± 0.056 |
2.333 ± 0.031 | 4.732 ± 0.043 |
1.962 ± 0.04 | 10.882 ± 0.084 |
Met |
Asn |
Gln |
Pro |
Arg |
Ser |
Thr |
Val |
Trp |
Tyr |
|---|---|---|---|---|---|---|---|---|---|
2.341 ± 0.026 | 2.373 ± 0.04 |
5.102 ± 0.05 | 3.789 ± 0.04 |
7.743 ± 0.07 | 4.93 ± 0.032 |
5.221 ± 0.052 | 7.492 ± 0.046 |
1.359 ± 0.027 | 2.229 ± 0.029 |
Most of the basic statistics you can see at this page can be downloaded from this CSV file
Proteome-pI is available under Creative Commons Attribution-NoDerivs license, for more details see here
| Reference: Kozlowski LP. Proteome-pI 2.0: Proteome Isoelectric Point Database Update. Nucleic Acids Res. 2021, doi: 10.1093/nar/gkab944 | Contact: Lukasz P. Kozlowski |
