Streptomyces spinoverrucosus
Taxonomy:
Average proteome isoelectric point is 6.36
Get precalculated fractions of proteins

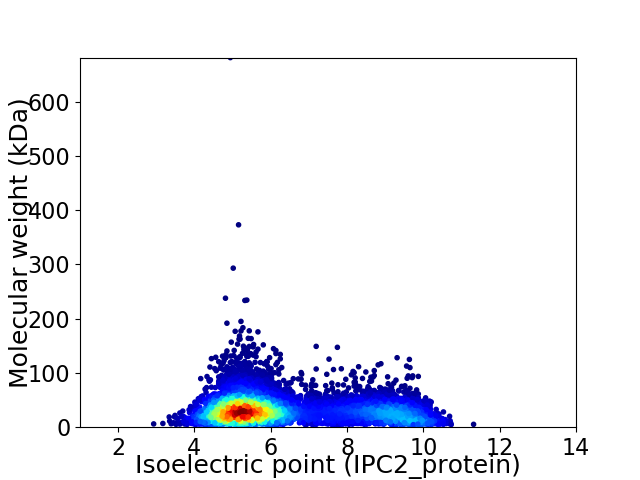
Virtual 2D-PAGE plot for 8452 proteins (isoelectric point calculated using IPC2_protein)
Get csv file with sequences according to given criteria:
* You can choose from 21 different methods for calculating isoelectric point
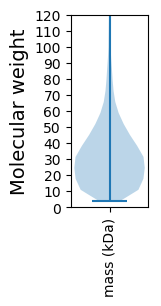
Summary statistics related to proteome-wise predictions


Protein with the lowest isoelectric point:
>tr|A0A4Y3VM05|A0A4Y3VM05_9ACTN Uncharacterized protein OS=Streptomyces spinoverrucosus OX=284043 GN=SSP24_55320 PE=4 SV=1
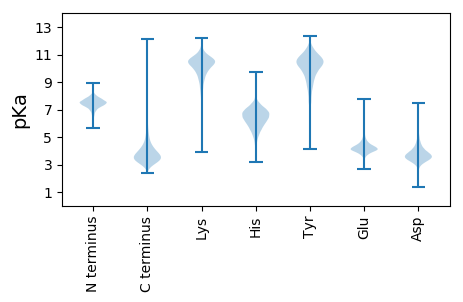
MM1 pKa = 7.1YY2 pKa = 10.28SVYY5 pKa = 10.04DD6 pKa = 3.74TAQEE10 pKa = 3.72ITDD13 pKa = 3.71YY14 pKa = 11.67LNAFVAADD22 pKa = 3.82LPILIGEE29 pKa = 4.67FGGPPDD35 pKa = 3.3QWGDD39 pKa = 3.55PDD41 pKa = 4.84EE42 pKa = 4.52DD43 pKa = 3.75TMMAAAEE50 pKa = 4.0QLDD53 pKa = 4.24LGYY56 pKa = 10.47LAWSWSGNTDD66 pKa = 4.46PILDD70 pKa = 4.08LAIDD74 pKa = 4.3FDD76 pKa = 4.53PSRR79 pKa = 11.84LSSWGQRR86 pKa = 11.84IFHH89 pKa = 6.64GANGIAQTSKK99 pKa = 10.04EE100 pKa = 3.85ATIFGGGTPTDD111 pKa = 4.03TQPPTAPGTPSASAVTSTSVTLTWPAATDD140 pKa = 3.63NVRR143 pKa = 11.84VTAYY147 pKa = 10.61DD148 pKa = 3.54VVRR151 pKa = 11.84VAGASEE157 pKa = 3.86PTAASSATDD166 pKa = 3.28TATVSGLTAGTTYY179 pKa = 10.61TFAVYY184 pKa = 10.54ARR186 pKa = 11.84DD187 pKa = 3.5ATGNRR192 pKa = 11.84SPRR195 pKa = 11.84SATVTVTTADD205 pKa = 3.69APAVACSVGYY215 pKa = 9.84RR216 pKa = 11.84VVNEE220 pKa = 4.02WPGGFQGEE228 pKa = 4.36VVIRR232 pKa = 11.84NTGTTPLNGWTLAFTFTDD250 pKa = 3.86GQTITNMWGGTASQTGGAVTVTPASYY276 pKa = 10.36TSTIPAGGSVMVGFVGASGATNTAPTAFTLNGGNCAAGG314 pKa = 3.28
MM1 pKa = 7.1YY2 pKa = 10.28SVYY5 pKa = 10.04DD6 pKa = 3.74TAQEE10 pKa = 3.72ITDD13 pKa = 3.71YY14 pKa = 11.67LNAFVAADD22 pKa = 3.82LPILIGEE29 pKa = 4.67FGGPPDD35 pKa = 3.3QWGDD39 pKa = 3.55PDD41 pKa = 4.84EE42 pKa = 4.52DD43 pKa = 3.75TMMAAAEE50 pKa = 4.0QLDD53 pKa = 4.24LGYY56 pKa = 10.47LAWSWSGNTDD66 pKa = 4.46PILDD70 pKa = 4.08LAIDD74 pKa = 4.3FDD76 pKa = 4.53PSRR79 pKa = 11.84LSSWGQRR86 pKa = 11.84IFHH89 pKa = 6.64GANGIAQTSKK99 pKa = 10.04EE100 pKa = 3.85ATIFGGGTPTDD111 pKa = 4.03TQPPTAPGTPSASAVTSTSVTLTWPAATDD140 pKa = 3.63NVRR143 pKa = 11.84VTAYY147 pKa = 10.61DD148 pKa = 3.54VVRR151 pKa = 11.84VAGASEE157 pKa = 3.86PTAASSATDD166 pKa = 3.28TATVSGLTAGTTYY179 pKa = 10.61TFAVYY184 pKa = 10.54ARR186 pKa = 11.84DD187 pKa = 3.5ATGNRR192 pKa = 11.84SPRR195 pKa = 11.84SATVTVTTADD205 pKa = 3.69APAVACSVGYY215 pKa = 9.84RR216 pKa = 11.84VVNEE220 pKa = 4.02WPGGFQGEE228 pKa = 4.36VVIRR232 pKa = 11.84NTGTTPLNGWTLAFTFTDD250 pKa = 3.86GQTITNMWGGTASQTGGAVTVTPASYY276 pKa = 10.36TSTIPAGGSVMVGFVGASGATNTAPTAFTLNGGNCAAGG314 pKa = 3.28
Molecular weight: 32.06 kDa
Isoelectric point according different methods:
Protein with the highest isoelectric point:
>tr|A0A4Y3VUR0|A0A4Y3VUR0_9ACTN DDE_Tnp_ISL3 domain-containing protein OS=Streptomyces spinoverrucosus OX=284043 GN=SSP24_83590 PE=4 SV=1
MM1 pKa = 7.69SKK3 pKa = 9.0RR4 pKa = 11.84TFQPNNRR11 pKa = 11.84RR12 pKa = 11.84RR13 pKa = 11.84AKK15 pKa = 8.7THH17 pKa = 5.15GFRR20 pKa = 11.84LRR22 pKa = 11.84MRR24 pKa = 11.84TRR26 pKa = 11.84AGRR29 pKa = 11.84AILASRR35 pKa = 11.84RR36 pKa = 11.84SKK38 pKa = 10.75GRR40 pKa = 11.84ARR42 pKa = 11.84LSAA45 pKa = 3.91
MM1 pKa = 7.69SKK3 pKa = 9.0RR4 pKa = 11.84TFQPNNRR11 pKa = 11.84RR12 pKa = 11.84RR13 pKa = 11.84AKK15 pKa = 8.7THH17 pKa = 5.15GFRR20 pKa = 11.84LRR22 pKa = 11.84MRR24 pKa = 11.84TRR26 pKa = 11.84AGRR29 pKa = 11.84AILASRR35 pKa = 11.84RR36 pKa = 11.84SKK38 pKa = 10.75GRR40 pKa = 11.84ARR42 pKa = 11.84LSAA45 pKa = 3.91
Molecular weight: 5.28 kDa
Isoelectric point according different methods:
Peptides (in silico digests for buttom-up proteomics)
Below you can find in silico digests of the whole proteome with Trypsin, Chymotrypsin, Trypsin+LysC, LysN, ArgC proteases suitable for different mass spec machines.| Try ESI |
 |
|---|
| ChTry ESI |
 |
|---|
| ArgC ESI |
 |
|---|
| LysN ESI |
 |
|---|
| TryLysC ESI |
 |
|---|
| Try MALDI |
 |
|---|
| ChTry MALDI |
 |
|---|
| ArgC MALDI |
 |
|---|
| LysN MALDI |
 |
|---|
| TryLysC MALDI |
 |
|---|
| Try LTQ |
 |
|---|
| ChTry LTQ |
 |
|---|
| ArgC LTQ |
 |
|---|
| LysN LTQ |
 |
|---|
| TryLysC LTQ |
 |
|---|
| Try MSlow |
 |
|---|
| ChTry MSlow |
 |
|---|
| ArgC MSlow |
 |
|---|
| LysN MSlow |
 |
|---|
| TryLysC MSlow |
 |
|---|
| Try MShigh |
 |
|---|
| ChTry MShigh |
 |
|---|
| ArgC MShigh |
 |
|---|
| LysN MShigh |
 |
|---|
| TryLysC MShigh |
 |
|---|
General Statistics
Number of major isoforms |
Number of additional isoforms |
Number of all proteins |
Number of amino acids |
Min. Seq. Length |
Max. Seq. Length |
Avg. Seq. Length |
Avg. Mol. Weight |
|---|---|---|---|---|---|---|---|
0 |
2674752 |
39 |
6275 |
316.5 |
33.98 |
Amino acid frequency
Ala |
Cys |
Asp |
Glu |
Phe |
Gly |
His |
Ile |
Lys |
Leu |
|---|---|---|---|---|---|---|---|---|---|
13.282 ± 0.038 | 0.807 ± 0.007 |
6.008 ± 0.02 | 5.747 ± 0.028 |
2.713 ± 0.015 | 9.31 ± 0.025 |
2.317 ± 0.012 | 3.265 ± 0.015 |
2.217 ± 0.02 | 10.253 ± 0.035 |
Met |
Asn |
Gln |
Pro |
Arg |
Ser |
Thr |
Val |
Trp |
Tyr |
|---|---|---|---|---|---|---|---|---|---|
1.748 ± 0.009 | 1.859 ± 0.014 |
6.072 ± 0.022 | 2.899 ± 0.016 |
8.006 ± 0.029 | 5.021 ± 0.02 |
6.297 ± 0.023 | 8.445 ± 0.022 |
1.561 ± 0.012 | 2.173 ± 0.014 |
Most of the basic statistics you can see at this page can be downloaded from this CSV file
Proteome-pI is available under Creative Commons Attribution-NoDerivs license, for more details see here
| Reference: Kozlowski LP. Proteome-pI 2.0: Proteome Isoelectric Point Database Update. Nucleic Acids Res. 2021, doi: 10.1093/nar/gkab944 | Contact: Lukasz P. Kozlowski |
