Synechococcus phage S-CBS1
Taxonomy: Viruses; Duplodnaviria; Heunggongvirae; Uroviricota; Caudoviricetes; Caudovirales; Siphoviridae; unclassified Siphoviridae
Average proteome isoelectric point is 5.7
Get precalculated fractions of proteins

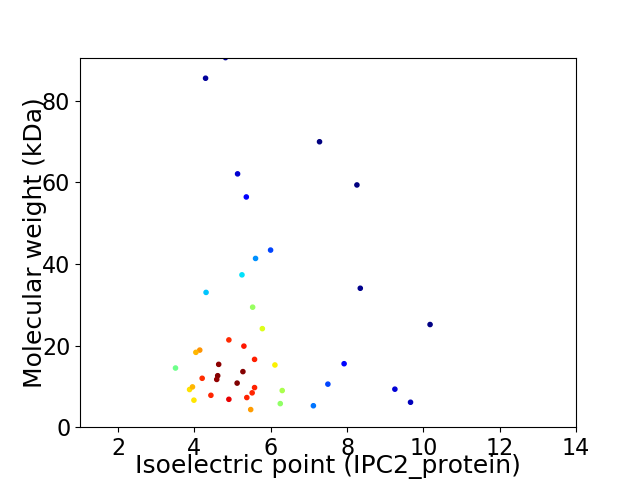
Virtual 2D-PAGE plot for 43 proteins (isoelectric point calculated using IPC2_protein)
Get csv file with sequences according to given criteria:
* You can choose from 21 different methods for calculating isoelectric point
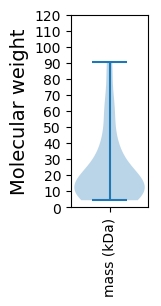
Summary statistics related to proteome-wise predictions


Protein with the lowest isoelectric point:
>tr|G8CLA7|G8CLA7_9CAUD Major tropism determinant OS=Synechococcus phage S-CBS1 OX=909297 GN=mtd PE=4 SV=1
MM1 pKa = 7.48SLPRR5 pKa = 11.84IGGFSAPGTADD16 pKa = 3.77YY17 pKa = 11.67ADD19 pKa = 4.59LDD21 pKa = 4.08YY22 pKa = 11.54DD23 pKa = 3.98GSDD26 pKa = 3.17RR27 pKa = 11.84LITITYY33 pKa = 8.17KK34 pKa = 10.56QGGASGGVVGTLNMTYY50 pKa = 10.23VGEE53 pKa = 4.32STNVDD58 pKa = 3.67TIYY61 pKa = 10.6WSS63 pKa = 3.21
MM1 pKa = 7.48SLPRR5 pKa = 11.84IGGFSAPGTADD16 pKa = 3.77YY17 pKa = 11.67ADD19 pKa = 4.59LDD21 pKa = 4.08YY22 pKa = 11.54DD23 pKa = 3.98GSDD26 pKa = 3.17RR27 pKa = 11.84LITITYY33 pKa = 8.17KK34 pKa = 10.56QGGASGGVVGTLNMTYY50 pKa = 10.23VGEE53 pKa = 4.32STNVDD58 pKa = 3.67TIYY61 pKa = 10.6WSS63 pKa = 3.21
Molecular weight: 6.63 kDa
Isoelectric point according different methods:
Protein with the highest isoelectric point:
>tr|G8CLE3|G8CLE3_9CAUD Uncharacterized protein OS=Synechococcus phage S-CBS1 OX=909297 GN=S-CBS1_gp43 PE=4 SV=1
MM1 pKa = 7.44LAIKK5 pKa = 10.54LIDD8 pKa = 4.55NIEE11 pKa = 3.75KK12 pKa = 9.28TAIKK16 pKa = 10.2RR17 pKa = 11.84VTNMQKK23 pKa = 10.45QMAFASSVALNEE35 pKa = 3.89TAFQARR41 pKa = 11.84QSLNKK46 pKa = 9.7STVQFFNAPVKK57 pKa = 9.0FTQSAFLVEE66 pKa = 4.55KK67 pKa = 10.56SKK69 pKa = 9.42KK70 pKa = 7.64TNLIATVYY78 pKa = 10.5AQDD81 pKa = 3.42AAGKK85 pKa = 10.11DD86 pKa = 3.04RR87 pKa = 11.84ARR89 pKa = 11.84YY90 pKa = 9.51LRR92 pKa = 11.84FGTAGGTRR100 pKa = 11.84PQKK103 pKa = 9.89GFEE106 pKa = 4.18RR107 pKa = 11.84FFSGAIPSDD116 pKa = 3.46GTIPPGSYY124 pKa = 10.73FMPTSTVKK132 pKa = 9.95TNRR135 pKa = 11.84HH136 pKa = 5.39GNVSQATLRR145 pKa = 11.84RR146 pKa = 11.84ITKK149 pKa = 9.87GINGDD154 pKa = 3.34PRR156 pKa = 11.84GGFFMGTPRR165 pKa = 11.84GGNRR169 pKa = 11.84PPGIYY174 pKa = 9.47RR175 pKa = 11.84RR176 pKa = 11.84SRR178 pKa = 11.84LRR180 pKa = 11.84LTPYY184 pKa = 10.68FIATQDD190 pKa = 3.56KK191 pKa = 9.68PDD193 pKa = 3.42YY194 pKa = 8.67TARR197 pKa = 11.84FPISTITQKK206 pKa = 10.22VVQRR210 pKa = 11.84SYY212 pKa = 11.49SGNFQTALAKK222 pKa = 10.63ALATARR228 pKa = 3.91
MM1 pKa = 7.44LAIKK5 pKa = 10.54LIDD8 pKa = 4.55NIEE11 pKa = 3.75KK12 pKa = 9.28TAIKK16 pKa = 10.2RR17 pKa = 11.84VTNMQKK23 pKa = 10.45QMAFASSVALNEE35 pKa = 3.89TAFQARR41 pKa = 11.84QSLNKK46 pKa = 9.7STVQFFNAPVKK57 pKa = 9.0FTQSAFLVEE66 pKa = 4.55KK67 pKa = 10.56SKK69 pKa = 9.42KK70 pKa = 7.64TNLIATVYY78 pKa = 10.5AQDD81 pKa = 3.42AAGKK85 pKa = 10.11DD86 pKa = 3.04RR87 pKa = 11.84ARR89 pKa = 11.84YY90 pKa = 9.51LRR92 pKa = 11.84FGTAGGTRR100 pKa = 11.84PQKK103 pKa = 9.89GFEE106 pKa = 4.18RR107 pKa = 11.84FFSGAIPSDD116 pKa = 3.46GTIPPGSYY124 pKa = 10.73FMPTSTVKK132 pKa = 9.95TNRR135 pKa = 11.84HH136 pKa = 5.39GNVSQATLRR145 pKa = 11.84RR146 pKa = 11.84ITKK149 pKa = 9.87GINGDD154 pKa = 3.34PRR156 pKa = 11.84GGFFMGTPRR165 pKa = 11.84GGNRR169 pKa = 11.84PPGIYY174 pKa = 9.47RR175 pKa = 11.84RR176 pKa = 11.84SRR178 pKa = 11.84LRR180 pKa = 11.84LTPYY184 pKa = 10.68FIATQDD190 pKa = 3.56KK191 pKa = 9.68PDD193 pKa = 3.42YY194 pKa = 8.67TARR197 pKa = 11.84FPISTITQKK206 pKa = 10.22VVQRR210 pKa = 11.84SYY212 pKa = 11.49SGNFQTALAKK222 pKa = 10.63ALATARR228 pKa = 3.91
Molecular weight: 25.17 kDa
Isoelectric point according different methods:
Peptides (in silico digests for buttom-up proteomics)
Below you can find in silico digests of the whole proteome with Trypsin, Chymotrypsin, Trypsin+LysC, LysN, ArgC proteases suitable for different mass spec machines.| Try ESI |
 |
|---|
| ChTry ESI |
 |
|---|
| ArgC ESI |
 |
|---|
| LysN ESI |
 |
|---|
| TryLysC ESI |
 |
|---|
| Try MALDI |
 |
|---|
| ChTry MALDI |
 |
|---|
| ArgC MALDI |
 |
|---|
| LysN MALDI |
 |
|---|
| TryLysC MALDI |
 |
|---|
| Try LTQ |
 |
|---|
| ChTry LTQ |
 |
|---|
| ArgC LTQ |
 |
|---|
| LysN LTQ |
 |
|---|
| TryLysC LTQ |
 |
|---|
| Try MSlow |
 |
|---|
| ChTry MSlow |
 |
|---|
| ArgC MSlow |
 |
|---|
| LysN MSlow |
 |
|---|
| TryLysC MSlow |
 |
|---|
| Try MShigh |
 |
|---|
| ChTry MShigh |
 |
|---|
| ArgC MShigh |
 |
|---|
| LysN MShigh |
 |
|---|
| TryLysC MShigh |
 |
|---|
General Statistics
Number of major isoforms |
Number of additional isoforms |
Number of all proteins |
Number of amino acids |
Min. Seq. Length |
Max. Seq. Length |
Avg. Seq. Length |
Avg. Mol. Weight |
|---|---|---|---|---|---|---|---|
0 |
9374 |
40 |
836 |
218.0 |
23.83 |
Amino acid frequency
Ala |
Cys |
Asp |
Glu |
Phe |
Gly |
His |
Ile |
Lys |
Leu |
|---|---|---|---|---|---|---|---|---|---|
10.529 ± 0.552 | 1.056 ± 0.173 |
6.198 ± 0.279 | 6.113 ± 0.393 |
2.998 ± 0.252 | 8.161 ± 0.425 |
1.675 ± 0.234 | 4.918 ± 0.325 |
3.339 ± 0.258 | 8.47 ± 0.403 |
Met |
Asn |
Gln |
Pro |
Arg |
Ser |
Thr |
Val |
Trp |
Tyr |
|---|---|---|---|---|---|---|---|---|---|
2.24 ± 0.219 | 3.563 ± 0.197 |
5.163 ± 0.351 | 4.011 ± 0.235 |
6.337 ± 0.442 | 6.667 ± 0.308 |
7.094 ± 0.488 | 6.742 ± 0.278 |
1.856 ± 0.203 | 2.87 ± 0.215 |
Most of the basic statistics you can see at this page can be downloaded from this CSV file
Proteome-pI is available under Creative Commons Attribution-NoDerivs license, for more details see here
| Reference: Kozlowski LP. Proteome-pI 2.0: Proteome Isoelectric Point Database Update. Nucleic Acids Res. 2021, doi: 10.1093/nar/gkab944 | Contact: Lukasz P. Kozlowski |
