Penicillium digitatum (strain PHI26 / CECT 20796) (Green mold)
Taxonomy: cellular organisms; Eukaryota; Opisthokonta; Fungi; Dikarya; Ascomycota; saccharomyceta; Pezizomycotina; leotiomyceta; Eurotiomycetes; Eurotiomycetidae; Eurotiales; Aspergillaceae; Penicillium; Penicillium digitatum
Average proteome isoelectric point is 6.49
Get precalculated fractions of proteins

Virtual 2D-PAGE plot for 9101 proteins (isoelectric point calculated using IPC2_protein)
Get csv file with sequences according to given criteria:
* You can choose from 21 different methods for calculating isoelectric point
Summary statistics related to proteome-wise predictions


Protein with the lowest isoelectric point:
>tr|K9G177|K9G177_PEND2 Rho guanyl nucleotide exchange factor putative OS=Penicillium digitatum (strain PHI26 / CECT 20796) OX=1170229 GN=PDIG_75300 PE=4 SV=1
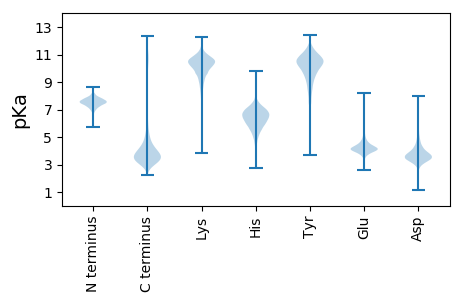
MM1 pKa = 7.64KK2 pKa = 10.39SFSPVALALMAAFGMVAADD21 pKa = 3.86TAASVSDD28 pKa = 4.16CASMCLSNMNAQASQLGCNSGDD50 pKa = 3.73LACLCKK56 pKa = 10.18SDD58 pKa = 3.69NYY60 pKa = 11.05KK61 pKa = 10.75FGIRR65 pKa = 11.84DD66 pKa = 3.82CTKK69 pKa = 9.63EE70 pKa = 4.02ACPSDD75 pKa = 5.06DD76 pKa = 3.99PEE78 pKa = 4.23QVLAMAVAKK87 pKa = 10.69CPGGVAGSDD96 pKa = 3.39TSSSSVSGSEE106 pKa = 4.05SSSTSSSDD114 pKa = 3.12SATTSGSDD122 pKa = 3.38STATSSDD129 pKa = 2.99ASATSTGAAVSTATGTDD146 pKa = 3.29VSVTSTDD153 pKa = 3.22ASGSKK158 pKa = 10.13AATGTDD164 pKa = 3.52VSATGTDD171 pKa = 3.39ASGSGSGASGSATSTGSVSTITSTDD196 pKa = 3.02ASSSMVTKK204 pKa = 10.74ASTGASSTSTGSSGSGSEE222 pKa = 4.2SGSGSGSGSSSDD234 pKa = 3.68SDD236 pKa = 3.76SSTSSSTAGAAASTTSHH253 pKa = 6.28GAAAAMATAGTGAMGVLGMLAIFALL278 pKa = 4.2
MM1 pKa = 7.64KK2 pKa = 10.39SFSPVALALMAAFGMVAADD21 pKa = 3.86TAASVSDD28 pKa = 4.16CASMCLSNMNAQASQLGCNSGDD50 pKa = 3.73LACLCKK56 pKa = 10.18SDD58 pKa = 3.69NYY60 pKa = 11.05KK61 pKa = 10.75FGIRR65 pKa = 11.84DD66 pKa = 3.82CTKK69 pKa = 9.63EE70 pKa = 4.02ACPSDD75 pKa = 5.06DD76 pKa = 3.99PEE78 pKa = 4.23QVLAMAVAKK87 pKa = 10.69CPGGVAGSDD96 pKa = 3.39TSSSSVSGSEE106 pKa = 4.05SSSTSSSDD114 pKa = 3.12SATTSGSDD122 pKa = 3.38STATSSDD129 pKa = 2.99ASATSTGAAVSTATGTDD146 pKa = 3.29VSVTSTDD153 pKa = 3.22ASGSKK158 pKa = 10.13AATGTDD164 pKa = 3.52VSATGTDD171 pKa = 3.39ASGSGSGASGSATSTGSVSTITSTDD196 pKa = 3.02ASSSMVTKK204 pKa = 10.74ASTGASSTSTGSSGSGSEE222 pKa = 4.2SGSGSGSGSSSDD234 pKa = 3.68SDD236 pKa = 3.76SSTSSSTAGAAASTTSHH253 pKa = 6.28GAAAAMATAGTGAMGVLGMLAIFALL278 pKa = 4.2
Molecular weight: 25.7 kDa
Isoelectric point according different methods:
Protein with the highest isoelectric point:
>tr|K9H0G0|K9H0G0_PEND2 Transcription factor BYE1 OS=Penicillium digitatum (strain PHI26 / CECT 20796) OX=1170229 GN=PDIG_07750 PE=3 SV=1
MM1 pKa = 7.91PKK3 pKa = 10.03RR4 pKa = 11.84PFGYY8 pKa = 9.73RR9 pKa = 11.84CSDD12 pKa = 3.62LLFPSFKK19 pKa = 10.86SLFNPPRR26 pKa = 11.84LILASNRR33 pKa = 11.84IVLCHH38 pKa = 6.81KK39 pKa = 9.63IWCHH43 pKa = 4.94RR44 pKa = 11.84LFMIFHH50 pKa = 6.7RR51 pKa = 11.84HH52 pKa = 4.68WSSIPIDD59 pKa = 3.54RR60 pKa = 11.84LHH62 pKa = 7.25RR63 pKa = 11.84SQAFLFDD70 pKa = 3.77YY71 pKa = 10.98SKK73 pKa = 11.58LCIFSIWHH81 pKa = 5.05SQIFAYY87 pKa = 8.97LTACRR92 pKa = 11.84STRR95 pKa = 3.23
MM1 pKa = 7.91PKK3 pKa = 10.03RR4 pKa = 11.84PFGYY8 pKa = 9.73RR9 pKa = 11.84CSDD12 pKa = 3.62LLFPSFKK19 pKa = 10.86SLFNPPRR26 pKa = 11.84LILASNRR33 pKa = 11.84IVLCHH38 pKa = 6.81KK39 pKa = 9.63IWCHH43 pKa = 4.94RR44 pKa = 11.84LFMIFHH50 pKa = 6.7RR51 pKa = 11.84HH52 pKa = 4.68WSSIPIDD59 pKa = 3.54RR60 pKa = 11.84LHH62 pKa = 7.25RR63 pKa = 11.84SQAFLFDD70 pKa = 3.77YY71 pKa = 10.98SKK73 pKa = 11.58LCIFSIWHH81 pKa = 5.05SQIFAYY87 pKa = 8.97LTACRR92 pKa = 11.84STRR95 pKa = 3.23
Molecular weight: 11.49 kDa
Isoelectric point according different methods:
Peptides (in silico digests for buttom-up proteomics)
Below you can find in silico digests of the whole proteome with Trypsin, Chymotrypsin, Trypsin+LysC, LysN, ArgC proteases suitable for different mass spec machines.| Try ESI |
 |
|---|
| ChTry ESI |
 |
|---|
| ArgC ESI |
 |
|---|
| LysN ESI |
 |
|---|
| TryLysC ESI |
 |
|---|
| Try MALDI |
 |
|---|
| ChTry MALDI |
 |
|---|
| ArgC MALDI |
 |
|---|
| LysN MALDI |
 |
|---|
| TryLysC MALDI |
 |
|---|
| Try LTQ |
 |
|---|
| ChTry LTQ |
 |
|---|
| ArgC LTQ |
 |
|---|
| LysN LTQ |
 |
|---|
| TryLysC LTQ |
 |
|---|
| Try MSlow |
 |
|---|
| ChTry MSlow |
 |
|---|
| ArgC MSlow |
 |
|---|
| LysN MSlow |
 |
|---|
| TryLysC MSlow |
 |
|---|
| Try MShigh |
 |
|---|
| ChTry MShigh |
 |
|---|
| ArgC MShigh |
 |
|---|
| LysN MShigh |
 |
|---|
| TryLysC MShigh |
 |
|---|
General Statistics
Number of major isoforms |
Number of additional isoforms |
Number of all proteins |
Number of amino acids |
Min. Seq. Length |
Max. Seq. Length |
Avg. Seq. Length |
Avg. Mol. Weight |
|---|---|---|---|---|---|---|---|
0 |
4201956 |
29 |
7066 |
461.7 |
51.16 |
Amino acid frequency
Ala |
Cys |
Asp |
Glu |
Phe |
Gly |
His |
Ile |
Lys |
Leu |
|---|---|---|---|---|---|---|---|---|---|
8.351 ± 0.022 | 1.163 ± 0.009 |
5.685 ± 0.026 | 6.284 ± 0.028 |
3.763 ± 0.015 | 6.654 ± 0.022 |
2.44 ± 0.012 | 5.05 ± 0.017 |
4.816 ± 0.022 | 8.953 ± 0.029 |
Met |
Asn |
Gln |
Pro |
Arg |
Ser |
Thr |
Val |
Trp |
Tyr |
|---|---|---|---|---|---|---|---|---|---|
2.204 ± 0.01 | 3.763 ± 0.011 |
6.1 ± 0.032 | 4.089 ± 0.018 |
6.069 ± 0.025 | 8.412 ± 0.034 |
5.989 ± 0.02 | 6.118 ± 0.02 |
1.405 ± 0.009 | 2.688 ± 0.012 |
Most of the basic statistics you can see at this page can be downloaded from this CSV file
Proteome-pI is available under Creative Commons Attribution-NoDerivs license, for more details see here
| Reference: Kozlowski LP. Proteome-pI 2.0: Proteome Isoelectric Point Database Update. Nucleic Acids Res. 2021, doi: 10.1093/nar/gkab944 | Contact: Lukasz P. Kozlowski |
