Bamboo mosaic virus
Taxonomy: Viruses; Riboviria; Orthornavirae; Kitrinoviricota; Alsuviricetes; Tymovirales; Alphaflexiviridae; Potexvirus
Average proteome isoelectric point is 7.38
Get precalculated fractions of proteins
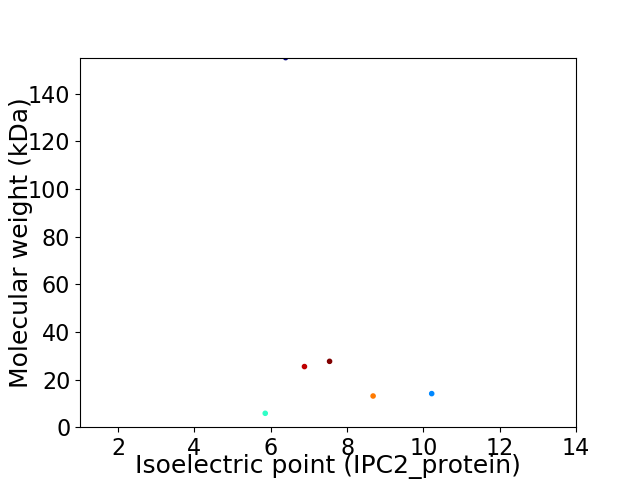
Virtual 2D-PAGE plot for 6 proteins (isoelectric point calculated using IPC2_protein)
Get csv file with sequences according to given criteria:
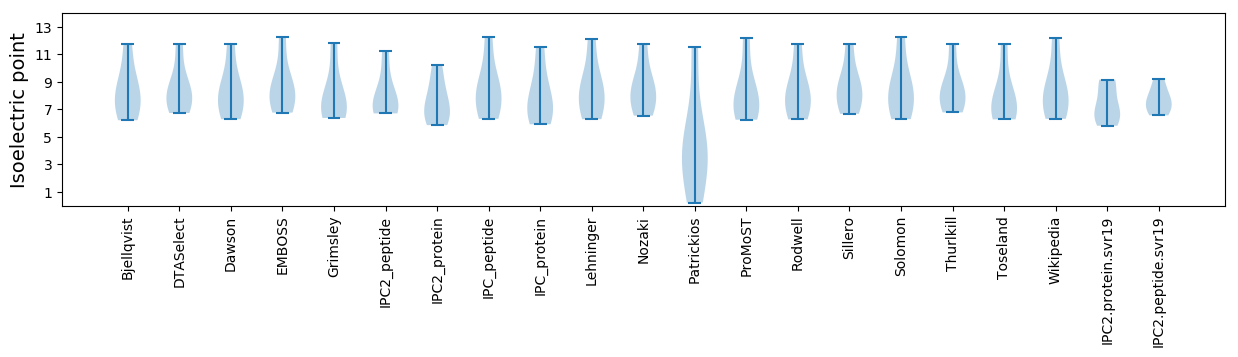
* You can choose from 21 different methods for calculating isoelectric point
Summary statistics related to proteome-wise predictions
Protein with the lowest isoelectric point:
>tr|Q89760|Q89760_9VIRU Coat protein OS=Bamboo mosaic virus OX=35286 GN=CP PE=3 SV=1
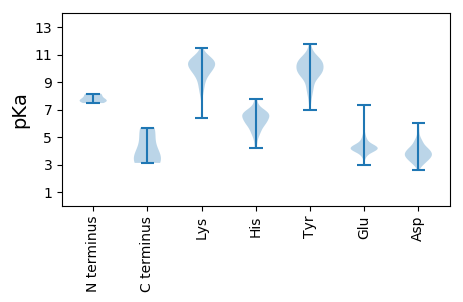
MM1 pKa = 7.68LNTDD5 pKa = 4.12TLCIILFILILGILYY20 pKa = 10.49NILQQHH26 pKa = 6.87LPPPCEE32 pKa = 3.99IIINGHH38 pKa = 5.5TISIRR43 pKa = 11.84GNCYY47 pKa = 8.75HH48 pKa = 6.05TTSSS52 pKa = 3.38
MM1 pKa = 7.68LNTDD5 pKa = 4.12TLCIILFILILGILYY20 pKa = 10.49NILQQHH26 pKa = 6.87LPPPCEE32 pKa = 3.99IIINGHH38 pKa = 5.5TISIRR43 pKa = 11.84GNCYY47 pKa = 8.75HH48 pKa = 6.05TTSSS52 pKa = 3.38
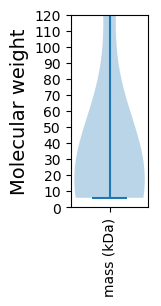
Molecular weight: 5.84 kDa
Isoelectric point according different methods:
Protein with the highest isoelectric point:
>tr|Q65007|Q65007_9VIRU ORF2=28k OS=Bamboo mosaic virus OX=35286 PE=4 SV=1
MM1 pKa = 8.07PLTCSSSRR9 pKa = 11.84SSASITQTQQLPKK22 pKa = 10.3PQTLNNKK29 pKa = 9.43KK30 pKa = 9.86VDD32 pKa = 3.84QNPTPTSRR40 pKa = 11.84SPFSKK45 pKa = 10.11PNAPRR50 pKa = 11.84TRR52 pKa = 11.84KK53 pKa = 9.86CPHH56 pKa = 5.96HH57 pKa = 6.61QNAKK61 pKa = 9.41RR62 pKa = 11.84LKK64 pKa = 9.49LRR66 pKa = 11.84KK67 pKa = 9.35RR68 pKa = 11.84PTKK71 pKa = 9.92QGPVQTPLSTLTKK84 pKa = 9.76RR85 pKa = 11.84QPRR88 pKa = 11.84QNPQTARR95 pKa = 11.84SGSAPHH101 pKa = 6.76CVNCHH106 pKa = 4.36GRR108 pKa = 11.84RR109 pKa = 11.84GSNYY113 pKa = 9.89FGALDD118 pKa = 4.13SKK120 pKa = 10.94ATLNSWTT127 pKa = 3.96
MM1 pKa = 8.07PLTCSSSRR9 pKa = 11.84SSASITQTQQLPKK22 pKa = 10.3PQTLNNKK29 pKa = 9.43KK30 pKa = 9.86VDD32 pKa = 3.84QNPTPTSRR40 pKa = 11.84SPFSKK45 pKa = 10.11PNAPRR50 pKa = 11.84TRR52 pKa = 11.84KK53 pKa = 9.86CPHH56 pKa = 5.96HH57 pKa = 6.61QNAKK61 pKa = 9.41RR62 pKa = 11.84LKK64 pKa = 9.49LRR66 pKa = 11.84KK67 pKa = 9.35RR68 pKa = 11.84PTKK71 pKa = 9.92QGPVQTPLSTLTKK84 pKa = 9.76RR85 pKa = 11.84QPRR88 pKa = 11.84QNPQTARR95 pKa = 11.84SGSAPHH101 pKa = 6.76CVNCHH106 pKa = 4.36GRR108 pKa = 11.84RR109 pKa = 11.84GSNYY113 pKa = 9.89FGALDD118 pKa = 4.13SKK120 pKa = 10.94ATLNSWTT127 pKa = 3.96
Molecular weight: 14.09 kDa
Isoelectric point according different methods:
Peptides (in silico digests for buttom-up proteomics)
Below you can find in silico digests of the whole proteome with Trypsin, Chymotrypsin, Trypsin+LysC, LysN, ArgC proteases suitable for different mass spec machines.| Try ESI |
 |
|---|
| ChTry ESI |
|
|---|
| ArgC ESI |
|
|---|
| LysN ESI |
|
|---|
| TryLysC ESI |
|
|---|
| Try MALDI |
|
|---|
| ChTry MALDI |
|
|---|
| ArgC MALDI |
|
|---|
| LysN MALDI |
|
|---|
| TryLysC MALDI |
|
|---|
| Try LTQ |
|
|---|
| ChTry LTQ |
|
|---|
| ArgC LTQ |
|
|---|
| LysN LTQ |
|
|---|
| TryLysC LTQ |
|
|---|
| Try MSlow |
|
|---|
| ChTry MSlow |
|
|---|
| ArgC MSlow |
|
|---|
| LysN MSlow |
|
|---|
| TryLysC MSlow |
|
|---|
| Try MShigh |
|
|---|
| ChTry MShigh |
|
|---|
| ArgC MShigh |
|
|---|
| LysN MShigh |
|
|---|
| TryLysC MShigh |
|
|---|
General Statistics
Number of major isoforms |
Number of additional isoforms |
Number of all proteins |
Number of amino acids |
Min. Seq. Length |
Max. Seq. Length |
Avg. Seq. Length |
Avg. Mol. Weight |
|---|---|---|---|---|---|---|---|
0 |
2158 |
52 |
1365 |
359.7 |
40.21 |
Amino acid frequency
Ala |
Cys |
Asp |
Glu |
Phe |
Gly |
His |
Ile |
Lys |
Leu |
|---|---|---|---|---|---|---|---|---|---|
8.387 ± 0.666 | 1.622 ± 0.271 |
4.773 ± 0.421 | 5.375 ± 1.572 |
3.29 ± 0.466 | 5.514 ± 1.293 |
3.29 ± 0.543 | 5.792 ± 0.771 |
6.395 ± 1.086 | 9.731 ± 0.695 |
Met |
Asn |
Gln |
Pro |
Arg |
Ser |
Thr |
Val |
Trp |
Tyr |
|---|---|---|---|---|---|---|---|---|---|
1.576 ± 0.247 | 4.449 ± 0.532 |
7.414 ± 0.867 | 4.495 ± 0.464 |
4.773 ± 0.471 | 5.607 ± 0.53 |
8.758 ± 1.212 | 3.846 ± 0.54 |
1.251 ± 0.246 | 3.661 ± 0.344 |
Most of the basic statistics you can see at this page can be downloaded from this CSV file
See this proteome in:

Proteome-pI is available under Creative Commons Attribution-NoDerivs license, for more details see here
| Reference: Kozlowski LP. Proteome-pI 2.0: Proteome Isoelectric Point Database Update. Nucleic Acids Res. 2021, doi: 10.1093/nar/gkab944 | Contact: Lukasz P. Kozlowski |