Sphingomonas sp. ABOLF
Taxonomy: cellular organisms; Bacteria; Proteobacteria; Alphaproteobacteria; Sphingomonadales; Sphingomonadaceae; Sphingomonas; unclassified Sphingomonas
Average proteome isoelectric point is 6.62
Get precalculated fractions of proteins
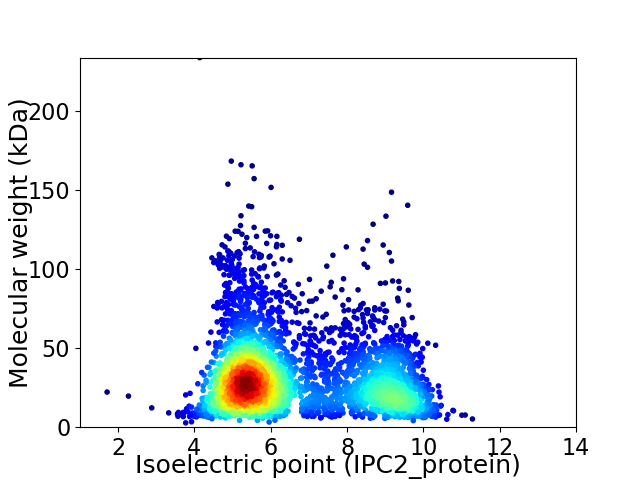
Virtual 2D-PAGE plot for 3641 proteins (isoelectric point calculated using IPC2_protein)
Get csv file with sequences according to given criteria:
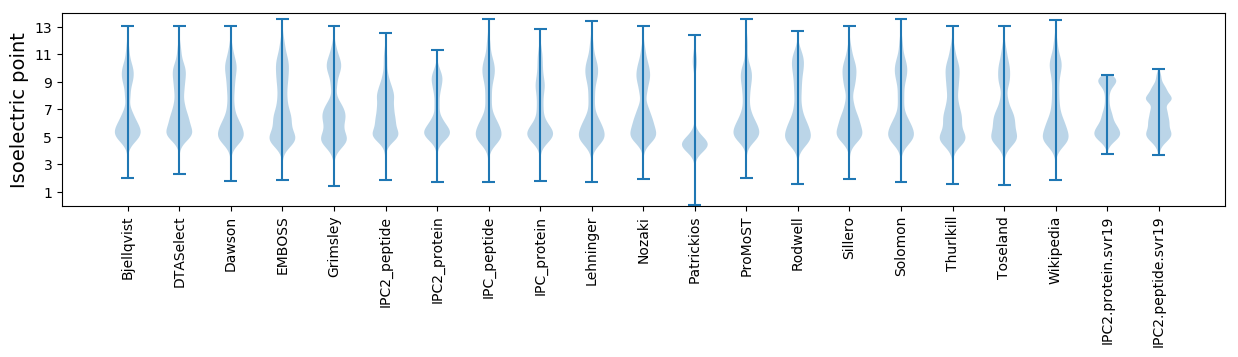
* You can choose from 21 different methods for calculating isoelectric point
Summary statistics related to proteome-wise predictions
Protein with the lowest isoelectric point:
>tr|A0A430DR42|A0A430DR42_9SPHN Endonuclease OS=Sphingomonas sp. ABOLF OX=1985879 GN=CA235_05890 PE=4 SV=1
MM1 pKa = 7.68EE2 pKa = 6.48IIRR5 pKa = 11.84LPSGEE10 pKa = 4.29VAPGDD15 pKa = 3.6VDD17 pKa = 4.41CISIVALSDD26 pKa = 3.07GRR28 pKa = 11.84YY29 pKa = 9.4DD30 pKa = 3.63LSGAALVACGDD41 pKa = 3.62GDD43 pKa = 4.06EE44 pKa = 4.47VQSVALIGLPPFEE57 pKa = 4.26TRR59 pKa = 11.84EE60 pKa = 4.01AAEE63 pKa = 4.27DD64 pKa = 4.09AGLAWAAEE72 pKa = 4.09QCVEE76 pKa = 4.61RR77 pKa = 11.84IYY79 pKa = 10.35VTDD82 pKa = 3.64VEE84 pKa = 5.24FCVQPP89 pKa = 3.72
MM1 pKa = 7.68EE2 pKa = 6.48IIRR5 pKa = 11.84LPSGEE10 pKa = 4.29VAPGDD15 pKa = 3.6VDD17 pKa = 4.41CISIVALSDD26 pKa = 3.07GRR28 pKa = 11.84YY29 pKa = 9.4DD30 pKa = 3.63LSGAALVACGDD41 pKa = 3.62GDD43 pKa = 4.06EE44 pKa = 4.47VQSVALIGLPPFEE57 pKa = 4.26TRR59 pKa = 11.84EE60 pKa = 4.01AAEE63 pKa = 4.27DD64 pKa = 4.09AGLAWAAEE72 pKa = 4.09QCVEE76 pKa = 4.61RR77 pKa = 11.84IYY79 pKa = 10.35VTDD82 pKa = 3.64VEE84 pKa = 5.24FCVQPP89 pKa = 3.72
Molecular weight: 9.36 kDa
Isoelectric point according different methods:
Protein with the highest isoelectric point:
>tr|A0A430DLG4|A0A430DLG4_9SPHN DMT family transporter OS=Sphingomonas sp. ABOLF OX=1985879 GN=CA235_11715 PE=4 SV=1
MM1 pKa = 7.45KK2 pKa = 9.61RR3 pKa = 11.84TFQPSNLVRR12 pKa = 11.84SRR14 pKa = 11.84RR15 pKa = 11.84HH16 pKa = 4.4GFRR19 pKa = 11.84TRR21 pKa = 11.84MATPGGRR28 pKa = 11.84KK29 pKa = 9.2VIRR32 pKa = 11.84ARR34 pKa = 11.84RR35 pKa = 11.84NRR37 pKa = 11.84GRR39 pKa = 11.84KK40 pKa = 9.0KK41 pKa = 10.58LSAA44 pKa = 4.03
MM1 pKa = 7.45KK2 pKa = 9.61RR3 pKa = 11.84TFQPSNLVRR12 pKa = 11.84SRR14 pKa = 11.84RR15 pKa = 11.84HH16 pKa = 4.4GFRR19 pKa = 11.84TRR21 pKa = 11.84MATPGGRR28 pKa = 11.84KK29 pKa = 9.2VIRR32 pKa = 11.84ARR34 pKa = 11.84RR35 pKa = 11.84NRR37 pKa = 11.84GRR39 pKa = 11.84KK40 pKa = 9.0KK41 pKa = 10.58LSAA44 pKa = 4.03
Molecular weight: 5.19 kDa
Isoelectric point according different methods:
Peptides (in silico digests for buttom-up proteomics)
Below you can find in silico digests of the whole proteome with Trypsin, Chymotrypsin, Trypsin+LysC, LysN, ArgC proteases suitable for different mass spec machines.| Try ESI |
 |
|---|
| ChTry ESI |
|
|---|
| ArgC ESI |
|
|---|
| LysN ESI |
|
|---|
| TryLysC ESI |
|
|---|
| Try MALDI |
|
|---|
| ChTry MALDI |
|
|---|
| ArgC MALDI |
|
|---|
| LysN MALDI |
|
|---|
| TryLysC MALDI |
|
|---|
| Try LTQ |
|
|---|
| ChTry LTQ |
|
|---|
| ArgC LTQ |
|
|---|
| LysN LTQ |
|
|---|
| TryLysC LTQ |
|
|---|
| Try MSlow |
|
|---|
| ChTry MSlow |
|
|---|
| ArgC MSlow |
|
|---|
| LysN MSlow |
|
|---|
| TryLysC MSlow |
|
|---|
| Try MShigh |
|
|---|
| ChTry MShigh |
|
|---|
| ArgC MShigh |
|
|---|
| LysN MShigh |
|
|---|
| TryLysC MShigh |
|
|---|
General Statistics
Number of major isoforms |
Number of additional isoforms |
Number of all proteins |
Number of amino acids |
Min. Seq. Length |
Max. Seq. Length |
Avg. Seq. Length |
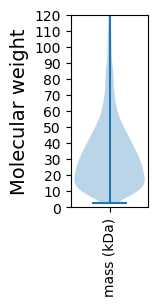
Avg. Mol. Weight |
|---|---|---|---|---|---|---|---|
0 |
1165691 |
26 |
2353 |
320.2 |
34.55 |
Amino acid frequency
Ala |
Cys |
Asp |
Glu |
Phe |
Gly |
His |
Ile |
Lys |
Leu |
|---|---|---|---|---|---|---|---|---|---|
13.816 ± 0.057 | 0.728 ± 0.012 |
5.834 ± 0.032 | 5.552 ± 0.036 |
3.423 ± 0.023 | 8.938 ± 0.039 |
1.92 ± 0.021 | 4.457 ± 0.023 |
2.641 ± 0.031 | 9.992 ± 0.049 |
Met |
Asn |
Gln |
Pro |
Arg |
Ser |
Thr |
Val |
Trp |
Tyr |
|---|---|---|---|---|---|---|---|---|---|
2.183 ± 0.021 | 2.405 ± 0.028 |
5.545 ± 0.033 | 3.203 ± 0.024 |
7.89 ± 0.044 | 5.009 ± 0.031 |
5.409 ± 0.03 | 7.395 ± 0.033 |
1.461 ± 0.018 | 2.199 ± 0.022 |
Most of the basic statistics you can see at this page can be downloaded from this CSV file
See this proteome in:

Proteome-pI is available under Creative Commons Attribution-NoDerivs license, for more details see here
| Reference: Kozlowski LP. Proteome-pI 2.0: Proteome Isoelectric Point Database Update. Nucleic Acids Res. 2021, doi: 10.1093/nar/gkab944 | Contact: Lukasz P. Kozlowski |