Halomonas axialensis
Taxonomy: cellular organisms; Bacteria; Proteobacteria; Gammaproteobacteria; Oceanospirillales; Halomonadaceae; Halomonas
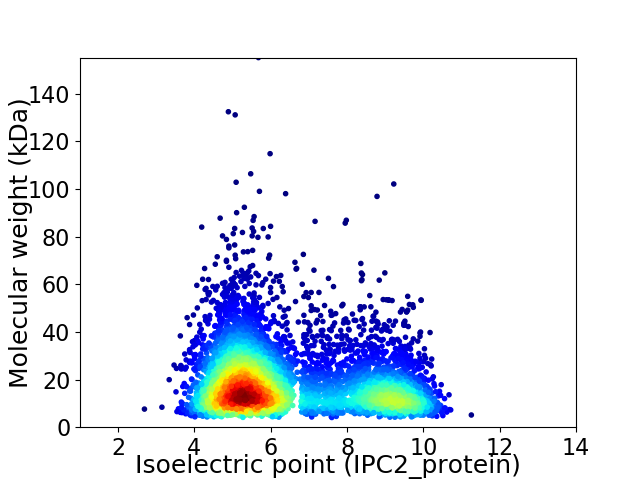
Average proteome isoelectric point is 6.49
Get precalculated fractions of proteins

Virtual 2D-PAGE plot for 5488 proteins (isoelectric point calculated using IPC2_protein)
Get csv file with sequences according to given criteria:
* You can choose from 21 different methods for calculating isoelectric point
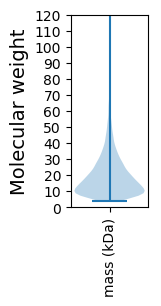
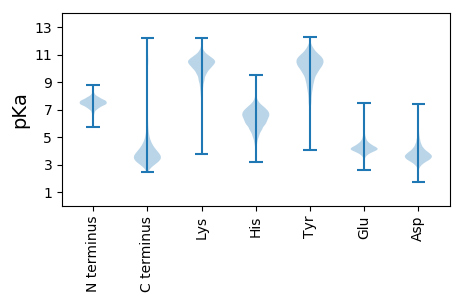
Summary statistics related to proteome-wise predictions


Protein with the lowest isoelectric point:
>tr|A0A455VCS9|A0A455VCS9_9GAMM Uncharacterized protein OS=Halomonas axialensis OX=115555 GN=HAALTHF_31320n PE=4 SV=2
MM1 pKa = 6.98TRR3 pKa = 11.84SNRR6 pKa = 11.84SALKK10 pKa = 10.32SLSLAPLTAALLASSLTITPTQAQEE35 pKa = 3.78RR36 pKa = 11.84SDD38 pKa = 5.84FSVCWSIYY46 pKa = 9.54AGWMPWAYY54 pKa = 10.59ADD56 pKa = 4.27VEE58 pKa = 4.6GVVNKK63 pKa = 9.46WADD66 pKa = 3.48EE67 pKa = 4.03YY68 pKa = 11.37GISIDD73 pKa = 3.57VVQVNDD79 pKa = 3.58YY80 pKa = 10.95VEE82 pKa = 5.1SINQFTSGNVDD93 pKa = 3.21GCAMTNMDD101 pKa = 5.17ALTIPAASGVDD112 pKa = 3.58STALIINDD120 pKa = 3.71YY121 pKa = 11.52SNGNDD126 pKa = 4.06GIVLKK131 pKa = 11.0GSDD134 pKa = 4.6DD135 pKa = 3.87LADD138 pKa = 3.16IAGRR142 pKa = 11.84QVNLVQFSVSHH153 pKa = 5.55YY154 pKa = 8.95FLARR158 pKa = 11.84ALEE161 pKa = 4.48SVGLTEE167 pKa = 5.89RR168 pKa = 11.84DD169 pKa = 3.11IEE171 pKa = 4.52TVNTSDD177 pKa = 3.85ADD179 pKa = 3.65IVGLFASDD187 pKa = 3.16TTEE190 pKa = 6.07AVAAWNPQLGAIEE203 pKa = 5.34DD204 pKa = 3.95MADD207 pKa = 3.41SNVVYY212 pKa = 9.71TSAEE216 pKa = 3.85IPGEE220 pKa = 4.05ILDD223 pKa = 3.75MMVVNTQTLADD234 pKa = 3.97NPALGHH240 pKa = 6.36ALVGAWYY247 pKa = 9.64EE248 pKa = 3.99VMGLIEE254 pKa = 5.73ADD256 pKa = 3.96DD257 pKa = 4.17EE258 pKa = 4.42NALGIMADD266 pKa = 3.6AAGTDD271 pKa = 2.98IDD273 pKa = 5.15GYY275 pKa = 9.8RR276 pKa = 11.84QQLAATYY283 pKa = 9.81LYY285 pKa = 9.65TDD287 pKa = 3.81PAEE290 pKa = 5.18AIALMEE296 pKa = 4.44SPEE299 pKa = 4.85LLDD302 pKa = 3.07TMQRR306 pKa = 11.84VAEE309 pKa = 4.39FSFQHH314 pKa = 6.2GLLGDD319 pKa = 3.89MAPNAEE325 pKa = 4.31VVGIEE330 pKa = 4.22TPSGVFGDD338 pKa = 3.95EE339 pKa = 4.5SNVQLRR345 pKa = 11.84FDD347 pKa = 3.75PSFTQAYY354 pKa = 10.42LDD356 pKa = 3.75AQQ358 pKa = 3.73
MM1 pKa = 6.98TRR3 pKa = 11.84SNRR6 pKa = 11.84SALKK10 pKa = 10.32SLSLAPLTAALLASSLTITPTQAQEE35 pKa = 3.78RR36 pKa = 11.84SDD38 pKa = 5.84FSVCWSIYY46 pKa = 9.54AGWMPWAYY54 pKa = 10.59ADD56 pKa = 4.27VEE58 pKa = 4.6GVVNKK63 pKa = 9.46WADD66 pKa = 3.48EE67 pKa = 4.03YY68 pKa = 11.37GISIDD73 pKa = 3.57VVQVNDD79 pKa = 3.58YY80 pKa = 10.95VEE82 pKa = 5.1SINQFTSGNVDD93 pKa = 3.21GCAMTNMDD101 pKa = 5.17ALTIPAASGVDD112 pKa = 3.58STALIINDD120 pKa = 3.71YY121 pKa = 11.52SNGNDD126 pKa = 4.06GIVLKK131 pKa = 11.0GSDD134 pKa = 4.6DD135 pKa = 3.87LADD138 pKa = 3.16IAGRR142 pKa = 11.84QVNLVQFSVSHH153 pKa = 5.55YY154 pKa = 8.95FLARR158 pKa = 11.84ALEE161 pKa = 4.48SVGLTEE167 pKa = 5.89RR168 pKa = 11.84DD169 pKa = 3.11IEE171 pKa = 4.52TVNTSDD177 pKa = 3.85ADD179 pKa = 3.65IVGLFASDD187 pKa = 3.16TTEE190 pKa = 6.07AVAAWNPQLGAIEE203 pKa = 5.34DD204 pKa = 3.95MADD207 pKa = 3.41SNVVYY212 pKa = 9.71TSAEE216 pKa = 3.85IPGEE220 pKa = 4.05ILDD223 pKa = 3.75MMVVNTQTLADD234 pKa = 3.97NPALGHH240 pKa = 6.36ALVGAWYY247 pKa = 9.64EE248 pKa = 3.99VMGLIEE254 pKa = 5.73ADD256 pKa = 3.96DD257 pKa = 4.17EE258 pKa = 4.42NALGIMADD266 pKa = 3.6AAGTDD271 pKa = 2.98IDD273 pKa = 5.15GYY275 pKa = 9.8RR276 pKa = 11.84QQLAATYY283 pKa = 9.81LYY285 pKa = 9.65TDD287 pKa = 3.81PAEE290 pKa = 5.18AIALMEE296 pKa = 4.44SPEE299 pKa = 4.85LLDD302 pKa = 3.07TMQRR306 pKa = 11.84VAEE309 pKa = 4.39FSFQHH314 pKa = 6.2GLLGDD319 pKa = 3.89MAPNAEE325 pKa = 4.31VVGIEE330 pKa = 4.22TPSGVFGDD338 pKa = 3.95EE339 pKa = 4.5SNVQLRR345 pKa = 11.84FDD347 pKa = 3.75PSFTQAYY354 pKa = 10.42LDD356 pKa = 3.75AQQ358 pKa = 3.73
Molecular weight: 38.3 kDa
Isoelectric point according different methods:
Protein with the highest isoelectric point:
>tr|A0A510J396|A0A510J396_9GAMM Ni_hydr_CYTB domain-containing protein OS=Halomonas axialensis OX=115555 GN=HAALTHF_16550n PE=4 SV=1
MM1 pKa = 7.45KK2 pKa = 9.51RR3 pKa = 11.84TFQPSVLKK11 pKa = 10.42RR12 pKa = 11.84KK13 pKa = 9.04RR14 pKa = 11.84AHH16 pKa = 6.12GFRR19 pKa = 11.84ARR21 pKa = 11.84MATKK25 pKa = 10.33NGRR28 pKa = 11.84AVIARR33 pKa = 11.84RR34 pKa = 11.84RR35 pKa = 11.84AKK37 pKa = 9.91GRR39 pKa = 11.84KK40 pKa = 8.85RR41 pKa = 11.84LSAA44 pKa = 3.96
MM1 pKa = 7.45KK2 pKa = 9.51RR3 pKa = 11.84TFQPSVLKK11 pKa = 10.42RR12 pKa = 11.84KK13 pKa = 9.04RR14 pKa = 11.84AHH16 pKa = 6.12GFRR19 pKa = 11.84ARR21 pKa = 11.84MATKK25 pKa = 10.33NGRR28 pKa = 11.84AVIARR33 pKa = 11.84RR34 pKa = 11.84RR35 pKa = 11.84AKK37 pKa = 9.91GRR39 pKa = 11.84KK40 pKa = 8.85RR41 pKa = 11.84LSAA44 pKa = 3.96
Molecular weight: 5.12 kDa
Isoelectric point according different methods:
Peptides (in silico digests for buttom-up proteomics)
Below you can find in silico digests of the whole proteome with Trypsin, Chymotrypsin, Trypsin+LysC, LysN, ArgC proteases suitable for different mass spec machines.| Try ESI |
 |
|---|
| ChTry ESI |
 |
|---|
| ArgC ESI |
 |
|---|
| LysN ESI |
 |
|---|
| TryLysC ESI |
 |
|---|
| Try MALDI |
 |
|---|
| ChTry MALDI |
 |
|---|
| ArgC MALDI |
 |
|---|
| LysN MALDI |
 |
|---|
| TryLysC MALDI |
 |
|---|
| Try LTQ |
 |
|---|
| ChTry LTQ |
 |
|---|
| ArgC LTQ |
 |
|---|
| LysN LTQ |
 |
|---|
| TryLysC LTQ |
 |
|---|
| Try MSlow |
 |
|---|
| ChTry MSlow |
 |
|---|
| ArgC MSlow |
 |
|---|
| LysN MSlow |
 |
|---|
| TryLysC MSlow |
 |
|---|
| Try MShigh |
 |
|---|
| ChTry MShigh |
 |
|---|
| ArgC MShigh |
 |
|---|
| LysN MShigh |
 |
|---|
| TryLysC MShigh |
 |
|---|
General Statistics
Number of major isoforms |
Number of additional isoforms |
Number of all proteins |
Number of amino acids |
Min. Seq. Length |
Max. Seq. Length |
Avg. Seq. Length |
Avg. Mol. Weight |
|---|---|---|---|---|---|---|---|
0 |
1002324 |
39 |
1404 |
182.6 |
20.1 |
Amino acid frequency
Ala |
Cys |
Asp |
Glu |
Phe |
Gly |
His |
Ile |
Lys |
Leu |
|---|---|---|---|---|---|---|---|---|---|
10.866 ± 0.045 | 1.104 ± 0.013 |
5.257 ± 0.035 | 6.097 ± 0.038 |
3.438 ± 0.027 | 7.696 ± 0.032 |
2.468 ± 0.019 | 4.847 ± 0.029 |
3.198 ± 0.029 | 11.014 ± 0.051 |
Met |
Asn |
Gln |
Pro |
Arg |
Ser |
Thr |
Val |
Trp |
Tyr |
|---|---|---|---|---|---|---|---|---|---|
2.811 ± 0.022 | 2.887 ± 0.024 |
4.969 ± 0.028 | 4.384 ± 0.027 |
6.725 ± 0.036 | 5.856 ± 0.027 |
5.286 ± 0.026 | 7.082 ± 0.034 |
1.555 ± 0.019 | 2.461 ± 0.018 |
Most of the basic statistics you can see at this page can be downloaded from this CSV file
Proteome-pI is available under Creative Commons Attribution-NoDerivs license, for more details see here
| Reference: Kozlowski LP. Proteome-pI 2.0: Proteome Isoelectric Point Database Update. Nucleic Acids Res. 2021, doi: 10.1093/nar/gkab944 | Contact: Lukasz P. Kozlowski |
