Nocardioides sp. Root190
Taxonomy: cellular organisms; Bacteria; Terrabacteria group; Actinobacteria; Actinomycetia; Propionibacteriales; Nocardioidaceae; Nocardioides; unclassified Nocardioides
Average proteome isoelectric point is 5.8
Get precalculated fractions of proteins

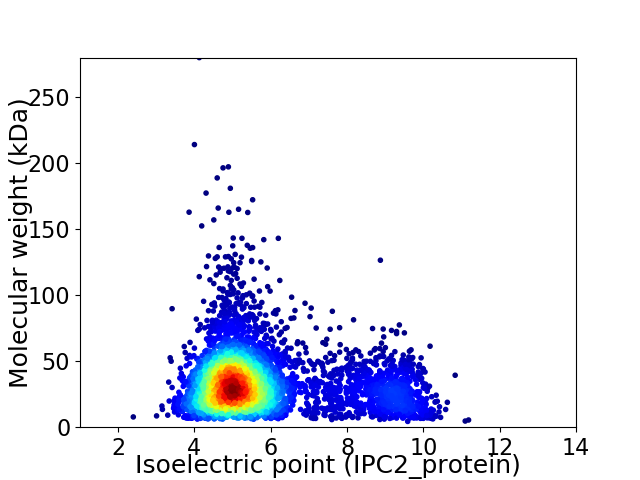
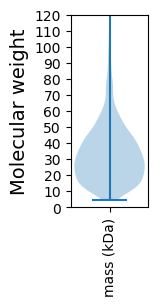
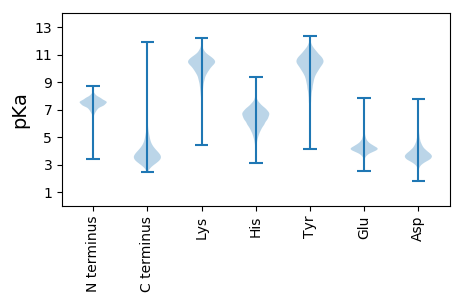
Virtual 2D-PAGE plot for 4603 proteins (isoelectric point calculated using IPC2_protein)
Get csv file with sequences according to given criteria:
* You can choose from 21 different methods for calculating isoelectric point
Summary statistics related to proteome-wise predictions


Protein with the lowest isoelectric point:
>tr|A0A0Q8Q6X4|A0A0Q8Q6X4_9ACTN Ribose import ATP-binding protein RbsA OS=Nocardioides sp. Root190 OX=1736488 GN=rbsA PE=3 SV=1
MM1 pKa = 7.6RR2 pKa = 11.84LSSRR6 pKa = 11.84FVSLSALALLAPAFAACSAFSEE28 pKa = 4.81GGGDD32 pKa = 3.42TTSGNGVSVAAAFYY46 pKa = 8.68PLAWVVEE53 pKa = 4.78EE54 pKa = 4.18VAEE57 pKa = 4.46GTGTEE62 pKa = 4.24VEE64 pKa = 4.66LLTSPGAEE72 pKa = 3.82PHH74 pKa = 6.86DD75 pKa = 4.54LEE77 pKa = 4.64LTVKK81 pKa = 8.66QTAVVVDD88 pKa = 4.28ADD90 pKa = 3.96LVLYY94 pKa = 10.35EE95 pKa = 5.33SGFQPAVDD103 pKa = 3.51DD104 pKa = 4.18TVAQNAEE111 pKa = 4.21GATLDD116 pKa = 3.39AAGIVDD122 pKa = 6.15LIPVEE127 pKa = 4.68EE128 pKa = 4.3SAEE131 pKa = 4.03EE132 pKa = 4.24HH133 pKa = 6.65EE134 pKa = 4.36EE135 pKa = 4.0HH136 pKa = 7.17ADD138 pKa = 4.28EE139 pKa = 5.02EE140 pKa = 4.94GHH142 pKa = 7.26DD143 pKa = 4.16HH144 pKa = 7.37DD145 pKa = 5.6HH146 pKa = 7.12DD147 pKa = 4.66HH148 pKa = 7.2GGLDD152 pKa = 3.26PHH154 pKa = 6.97FWQDD158 pKa = 3.76PLRR161 pKa = 11.84MAALADD167 pKa = 3.74AVAGEE172 pKa = 4.67LGALDD177 pKa = 4.52EE178 pKa = 5.1EE179 pKa = 4.69NADD182 pKa = 3.93TYY184 pKa = 11.74DD185 pKa = 3.54EE186 pKa = 4.15NAAALRR192 pKa = 11.84TDD194 pKa = 4.9LEE196 pKa = 4.37ALDD199 pKa = 4.45AEE201 pKa = 4.84YY202 pKa = 10.76AAGLTDD208 pKa = 4.14CEE210 pKa = 4.26RR211 pKa = 11.84DD212 pKa = 3.91TIVVSHH218 pKa = 7.24DD219 pKa = 2.92AFGYY223 pKa = 8.28LEE225 pKa = 4.24KK226 pKa = 11.15YY227 pKa = 9.65GVHH230 pKa = 6.55LASIVGLSPDD240 pKa = 4.15AEE242 pKa = 4.21PTGAVLGEE250 pKa = 4.01LQEE253 pKa = 4.85LIGEE257 pKa = 4.25EE258 pKa = 4.78GITTVFSEE266 pKa = 4.46PLEE269 pKa = 4.32PALGEE274 pKa = 4.24GLATDD279 pKa = 4.72LGLTNGTLDD288 pKa = 4.75PIEE291 pKa = 4.66GLSDD295 pKa = 3.24ATSGEE300 pKa = 4.69DD301 pKa = 3.65YY302 pKa = 11.03LSLMTSNLAAIQTANGCRR320 pKa = 3.41
MM1 pKa = 7.6RR2 pKa = 11.84LSSRR6 pKa = 11.84FVSLSALALLAPAFAACSAFSEE28 pKa = 4.81GGGDD32 pKa = 3.42TTSGNGVSVAAAFYY46 pKa = 8.68PLAWVVEE53 pKa = 4.78EE54 pKa = 4.18VAEE57 pKa = 4.46GTGTEE62 pKa = 4.24VEE64 pKa = 4.66LLTSPGAEE72 pKa = 3.82PHH74 pKa = 6.86DD75 pKa = 4.54LEE77 pKa = 4.64LTVKK81 pKa = 8.66QTAVVVDD88 pKa = 4.28ADD90 pKa = 3.96LVLYY94 pKa = 10.35EE95 pKa = 5.33SGFQPAVDD103 pKa = 3.51DD104 pKa = 4.18TVAQNAEE111 pKa = 4.21GATLDD116 pKa = 3.39AAGIVDD122 pKa = 6.15LIPVEE127 pKa = 4.68EE128 pKa = 4.3SAEE131 pKa = 4.03EE132 pKa = 4.24HH133 pKa = 6.65EE134 pKa = 4.36EE135 pKa = 4.0HH136 pKa = 7.17ADD138 pKa = 4.28EE139 pKa = 5.02EE140 pKa = 4.94GHH142 pKa = 7.26DD143 pKa = 4.16HH144 pKa = 7.37DD145 pKa = 5.6HH146 pKa = 7.12DD147 pKa = 4.66HH148 pKa = 7.2GGLDD152 pKa = 3.26PHH154 pKa = 6.97FWQDD158 pKa = 3.76PLRR161 pKa = 11.84MAALADD167 pKa = 3.74AVAGEE172 pKa = 4.67LGALDD177 pKa = 4.52EE178 pKa = 5.1EE179 pKa = 4.69NADD182 pKa = 3.93TYY184 pKa = 11.74DD185 pKa = 3.54EE186 pKa = 4.15NAAALRR192 pKa = 11.84TDD194 pKa = 4.9LEE196 pKa = 4.37ALDD199 pKa = 4.45AEE201 pKa = 4.84YY202 pKa = 10.76AAGLTDD208 pKa = 4.14CEE210 pKa = 4.26RR211 pKa = 11.84DD212 pKa = 3.91TIVVSHH218 pKa = 7.24DD219 pKa = 2.92AFGYY223 pKa = 8.28LEE225 pKa = 4.24KK226 pKa = 11.15YY227 pKa = 9.65GVHH230 pKa = 6.55LASIVGLSPDD240 pKa = 4.15AEE242 pKa = 4.21PTGAVLGEE250 pKa = 4.01LQEE253 pKa = 4.85LIGEE257 pKa = 4.25EE258 pKa = 4.78GITTVFSEE266 pKa = 4.46PLEE269 pKa = 4.32PALGEE274 pKa = 4.24GLATDD279 pKa = 4.72LGLTNGTLDD288 pKa = 4.75PIEE291 pKa = 4.66GLSDD295 pKa = 3.24ATSGEE300 pKa = 4.69DD301 pKa = 3.65YY302 pKa = 11.03LSLMTSNLAAIQTANGCRR320 pKa = 3.41
Molecular weight: 33.27 kDa
Isoelectric point according different methods:
Protein with the highest isoelectric point:
>tr|A0A0Q8Q533|A0A0Q8Q533_9ACTN Dehydrogenase OS=Nocardioides sp. Root190 OX=1736488 GN=ASE01_09150 PE=4 SV=1
MM1 pKa = 7.6KK2 pKa = 9.98VRR4 pKa = 11.84NSIRR8 pKa = 11.84SLKK11 pKa = 8.78NQPGAQVVRR20 pKa = 11.84RR21 pKa = 11.84RR22 pKa = 11.84GRR24 pKa = 11.84VFVINKK30 pKa = 7.77QNPRR34 pKa = 11.84MKK36 pKa = 10.39GRR38 pKa = 11.84QGG40 pKa = 3.03
MM1 pKa = 7.6KK2 pKa = 9.98VRR4 pKa = 11.84NSIRR8 pKa = 11.84SLKK11 pKa = 8.78NQPGAQVVRR20 pKa = 11.84RR21 pKa = 11.84RR22 pKa = 11.84GRR24 pKa = 11.84VFVINKK30 pKa = 7.77QNPRR34 pKa = 11.84MKK36 pKa = 10.39GRR38 pKa = 11.84QGG40 pKa = 3.03
Molecular weight: 4.66 kDa
Isoelectric point according different methods:
Peptides (in silico digests for buttom-up proteomics)
Below you can find in silico digests of the whole proteome with Trypsin, Chymotrypsin, Trypsin+LysC, LysN, ArgC proteases suitable for different mass spec machines.| Try ESI |
 |
|---|
| ChTry ESI |
 |
|---|
| ArgC ESI |
 |
|---|
| LysN ESI |
 |
|---|
| TryLysC ESI |
 |
|---|
| Try MALDI |
 |
|---|
| ChTry MALDI |
 |
|---|
| ArgC MALDI |
 |
|---|
| LysN MALDI |
 |
|---|
| TryLysC MALDI |
 |
|---|
| Try LTQ |
 |
|---|
| ChTry LTQ |
 |
|---|
| ArgC LTQ |
 |
|---|
| LysN LTQ |
 |
|---|
| TryLysC LTQ |
 |
|---|
| Try MSlow |
 |
|---|
| ChTry MSlow |
 |
|---|
| ArgC MSlow |
 |
|---|
| LysN MSlow |
 |
|---|
| TryLysC MSlow |
 |
|---|
| Try MShigh |
 |
|---|
| ChTry MShigh |
 |
|---|
| ArgC MShigh |
 |
|---|
| LysN MShigh |
 |
|---|
| TryLysC MShigh |
 |
|---|
General Statistics
Number of major isoforms |
Number of additional isoforms |
Number of all proteins |
Number of amino acids |
Min. Seq. Length |
Max. Seq. Length |
Avg. Seq. Length |
Avg. Mol. Weight |
|---|---|---|---|---|---|---|---|
0 |
1497011 |
37 |
2683 |
325.2 |
34.79 |
Amino acid frequency
Ala |
Cys |
Asp |
Glu |
Phe |
Gly |
His |
Ile |
Lys |
Leu |
|---|---|---|---|---|---|---|---|---|---|
12.994 ± 0.051 | 0.723 ± 0.009 |
6.542 ± 0.029 | 5.853 ± 0.037 |
2.843 ± 0.021 | 9.212 ± 0.038 |
2.133 ± 0.02 | 3.845 ± 0.025 |
2.074 ± 0.023 | 10.217 ± 0.043 |
Met |
Asn |
Gln |
Pro |
Arg |
Ser |
Thr |
Val |
Trp |
Tyr |
|---|---|---|---|---|---|---|---|---|---|
1.796 ± 0.014 | 1.879 ± 0.02 |
5.465 ± 0.026 | 2.76 ± 0.017 |
7.317 ± 0.04 | 5.416 ± 0.027 |
6.187 ± 0.035 | 9.318 ± 0.036 |
1.512 ± 0.014 | 1.912 ± 0.016 |
Most of the basic statistics you can see at this page can be downloaded from this CSV file
Proteome-pI is available under Creative Commons Attribution-NoDerivs license, for more details see here
| Reference: Kozlowski LP. Proteome-pI 2.0: Proteome Isoelectric Point Database Update. Nucleic Acids Res. 2021, doi: 10.1093/nar/gkab944 | Contact: Lukasz P. Kozlowski |
