Turkey aviadenovirus 5
Taxonomy: Viruses; Varidnaviria; Bamfordvirae; Preplasmiviricota; Tectiliviricetes; Rowavirales; Adenoviridae; Aviadenovirus; Turkey aviadenovirus D
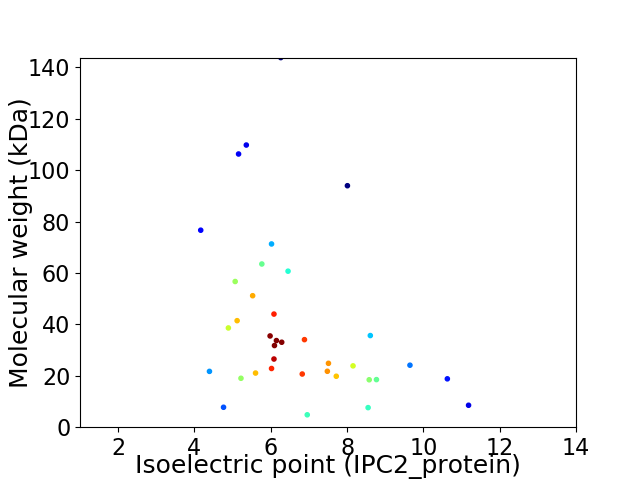
Average proteome isoelectric point is 6.61
Get precalculated fractions of proteins

Virtual 2D-PAGE plot for 37 proteins (isoelectric point calculated using IPC2_protein)
Get csv file with sequences according to given criteria:
* You can choose from 21 different methods for calculating isoelectric point
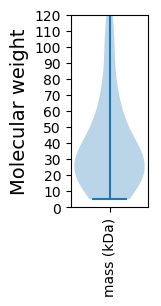
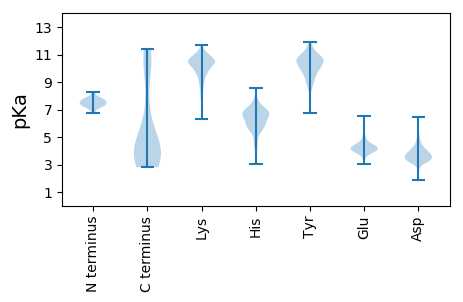
Summary statistics related to proteome-wise predictions


Protein with the lowest isoelectric point:
>tr|U5NEG4|U5NEG4_9ADEN ORF17 OS=Turkey aviadenovirus 5 OX=1408258 PE=4 SV=1
MM1 pKa = 7.26MNDD4 pKa = 3.09EE5 pKa = 4.44QLAEE9 pKa = 4.57LLQQAPDD16 pKa = 3.99DD17 pKa = 4.69GEE19 pKa = 4.47DD20 pKa = 3.55EE21 pKa = 4.32NGEE24 pKa = 4.29LEE26 pKa = 4.46MPAALHH32 pKa = 7.31AYY34 pKa = 9.5QLLCFEE40 pKa = 5.55SYY42 pKa = 10.54AIHH45 pKa = 6.74VGSCSCHH52 pKa = 6.02SLQLTRR58 pKa = 11.84LGLSACHH65 pKa = 5.79TAPSDD70 pKa = 3.19LATYY74 pKa = 9.59VWARR78 pKa = 11.84LQDD81 pKa = 3.85DD82 pKa = 4.21FNVAGLYY89 pKa = 9.02FVAMWACPAFRR100 pKa = 11.84DD101 pKa = 4.69FSPVFMSRR109 pKa = 11.84AVGRR113 pKa = 11.84NEE115 pKa = 4.61DD116 pKa = 3.69VLGMTIHH123 pKa = 6.36VGDD126 pKa = 4.07AARR129 pKa = 11.84LAFLIAVSRR138 pKa = 11.84MGEE141 pKa = 3.98AGASPCLYY149 pKa = 8.56MRR151 pKa = 11.84KK152 pKa = 8.71MDD154 pKa = 3.78IDD156 pKa = 3.66VEE158 pKa = 4.33EE159 pKa = 4.46QVVHH163 pKa = 6.42MFTDD167 pKa = 3.35DD168 pKa = 3.4WFSEE172 pKa = 4.42FANLLYY178 pKa = 10.41YY179 pKa = 9.04WQAAEE184 pKa = 3.55WRR186 pKa = 11.84FINEE190 pKa = 3.67QKK192 pKa = 11.09
MM1 pKa = 7.26MNDD4 pKa = 3.09EE5 pKa = 4.44QLAEE9 pKa = 4.57LLQQAPDD16 pKa = 3.99DD17 pKa = 4.69GEE19 pKa = 4.47DD20 pKa = 3.55EE21 pKa = 4.32NGEE24 pKa = 4.29LEE26 pKa = 4.46MPAALHH32 pKa = 7.31AYY34 pKa = 9.5QLLCFEE40 pKa = 5.55SYY42 pKa = 10.54AIHH45 pKa = 6.74VGSCSCHH52 pKa = 6.02SLQLTRR58 pKa = 11.84LGLSACHH65 pKa = 5.79TAPSDD70 pKa = 3.19LATYY74 pKa = 9.59VWARR78 pKa = 11.84LQDD81 pKa = 3.85DD82 pKa = 4.21FNVAGLYY89 pKa = 9.02FVAMWACPAFRR100 pKa = 11.84DD101 pKa = 4.69FSPVFMSRR109 pKa = 11.84AVGRR113 pKa = 11.84NEE115 pKa = 4.61DD116 pKa = 3.69VLGMTIHH123 pKa = 6.36VGDD126 pKa = 4.07AARR129 pKa = 11.84LAFLIAVSRR138 pKa = 11.84MGEE141 pKa = 3.98AGASPCLYY149 pKa = 8.56MRR151 pKa = 11.84KK152 pKa = 8.71MDD154 pKa = 3.78IDD156 pKa = 3.66VEE158 pKa = 4.33EE159 pKa = 4.46QVVHH163 pKa = 6.42MFTDD167 pKa = 3.35DD168 pKa = 3.4WFSEE172 pKa = 4.42FANLLYY178 pKa = 10.41YY179 pKa = 9.04WQAAEE184 pKa = 3.55WRR186 pKa = 11.84FINEE190 pKa = 3.67QKK192 pKa = 11.09
Molecular weight: 21.72 kDa
Isoelectric point according different methods:
Protein with the highest isoelectric point:
>tr|U5NEL9|U5NEL9_9ADEN DNA polymerase OS=Turkey aviadenovirus 5 OX=1408258 PE=3 SV=1
MM1 pKa = 7.45SVLISPSDD9 pKa = 3.51NRR11 pKa = 11.84GWGAGMRR18 pKa = 11.84YY19 pKa = 9.22RR20 pKa = 11.84RR21 pKa = 11.84RR22 pKa = 11.84TSMRR26 pKa = 11.84GVGRR30 pKa = 11.84RR31 pKa = 11.84RR32 pKa = 11.84MTLRR36 pKa = 11.84QLLGLGARR44 pKa = 11.84RR45 pKa = 11.84RR46 pKa = 11.84RR47 pKa = 11.84RR48 pKa = 11.84TRR50 pKa = 11.84PTTVSNRR57 pKa = 11.84LVVVSTRR64 pKa = 11.84RR65 pKa = 11.84RR66 pKa = 11.84SSRR69 pKa = 11.84RR70 pKa = 11.84RR71 pKa = 11.84RR72 pKa = 3.37
MM1 pKa = 7.45SVLISPSDD9 pKa = 3.51NRR11 pKa = 11.84GWGAGMRR18 pKa = 11.84YY19 pKa = 9.22RR20 pKa = 11.84RR21 pKa = 11.84RR22 pKa = 11.84TSMRR26 pKa = 11.84GVGRR30 pKa = 11.84RR31 pKa = 11.84RR32 pKa = 11.84MTLRR36 pKa = 11.84QLLGLGARR44 pKa = 11.84RR45 pKa = 11.84RR46 pKa = 11.84RR47 pKa = 11.84RR48 pKa = 11.84TRR50 pKa = 11.84PTTVSNRR57 pKa = 11.84LVVVSTRR64 pKa = 11.84RR65 pKa = 11.84RR66 pKa = 11.84SSRR69 pKa = 11.84RR70 pKa = 11.84RR71 pKa = 11.84RR72 pKa = 3.37
Molecular weight: 8.54 kDa
Isoelectric point according different methods:
Peptides (in silico digests for buttom-up proteomics)
Below you can find in silico digests of the whole proteome with Trypsin, Chymotrypsin, Trypsin+LysC, LysN, ArgC proteases suitable for different mass spec machines.| Try ESI |
 |
|---|
| ChTry ESI |
 |
|---|
| ArgC ESI |
 |
|---|
| LysN ESI |
 |
|---|
| TryLysC ESI |
 |
|---|
| Try MALDI |
 |
|---|
| ChTry MALDI |
 |
|---|
| ArgC MALDI |
 |
|---|
| LysN MALDI |
 |
|---|
| TryLysC MALDI |
 |
|---|
| Try LTQ |
 |
|---|
| ChTry LTQ |
 |
|---|
| ArgC LTQ |
 |
|---|
| LysN LTQ |
 |
|---|
| TryLysC LTQ |
 |
|---|
| Try MSlow |
 |
|---|
| ChTry MSlow |
 |
|---|
| ArgC MSlow |
 |
|---|
| LysN MSlow |
 |
|---|
| TryLysC MSlow |
 |
|---|
| Try MShigh |
 |
|---|
| ChTry MShigh |
 |
|---|
| ArgC MShigh |
 |
|---|
| LysN MShigh |
 |
|---|
| TryLysC MShigh |
 |
|---|
General Statistics
Number of major isoforms |
Number of additional isoforms |
Number of all proteins |
Number of amino acids |
Min. Seq. Length |
Max. Seq. Length |
Avg. Seq. Length |
Avg. Mol. Weight |
|---|---|---|---|---|---|---|---|
13304 |
46 |
1247 |
359.6 |
40.34 |
Amino acid frequency
Ala |
Cys |
Asp |
Glu |
Phe |
Gly |
His |
Ile |
Lys |
Leu |
|---|---|---|---|---|---|---|---|---|---|
7.434 ± 0.336 | 1.849 ± 0.241 |
5.622 ± 0.209 | 5.562 ± 0.502 |
4.142 ± 0.266 | 6.374 ± 0.441 |
2.21 ± 0.235 | 4.307 ± 0.252 |
3.751 ± 0.263 | 9.313 ± 0.353 |
Met |
Asn |
Gln |
Pro |
Arg |
Ser |
Thr |
Val |
Trp |
Tyr |
|---|---|---|---|---|---|---|---|---|---|
2.3 ± 0.167 | 4.262 ± 0.368 |
6.254 ± 0.288 | 3.593 ± 0.203 |
7.118 ± 0.484 | 7.426 ± 0.299 |
6.562 ± 0.421 | 6.622 ± 0.212 |
1.473 ± 0.147 | 3.826 ± 0.305 |
Most of the basic statistics you can see at this page can be downloaded from this CSV file
Proteome-pI is available under Creative Commons Attribution-NoDerivs license, for more details see here
| Reference: Kozlowski LP. Proteome-pI 2.0: Proteome Isoelectric Point Database Update. Nucleic Acids Res. 2021, doi: 10.1093/nar/gkab944 | Contact: Lukasz P. Kozlowski |
