Ulvibacter sp. MAR_2010_11
Taxonomy: cellular organisms; Bacteria; FCB group; Bacteroidetes/Chlorobi group; Bacteroidetes; Flavobacteriia; Flavobacteriales; Flavobacteriaceae; Ulvibacter; unclassified Ulvibacter
Average proteome isoelectric point is 6.34
Get precalculated fractions of proteins

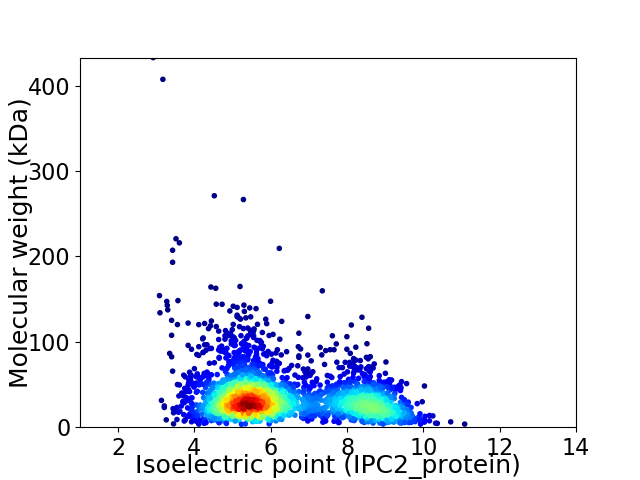
Virtual 2D-PAGE plot for 2733 proteins (isoelectric point calculated using IPC2_protein)
Get csv file with sequences according to given criteria:
* You can choose from 21 different methods for calculating isoelectric point
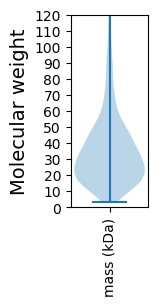
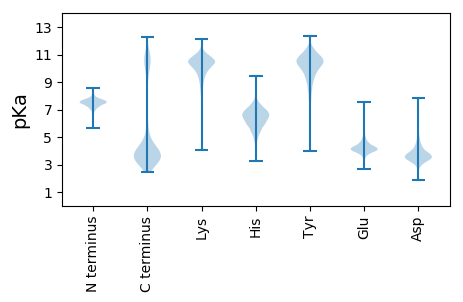
Summary statistics related to proteome-wise predictions


Protein with the lowest isoelectric point:
>tr|A0A2N0EWT1|A0A2N0EWT1_9FLAO Type I restriction and modification enzyme subunit R-like protein OS=Ulvibacter sp. MAR_2010_11 OX=1250229 GN=ATE92_2754 PE=4 SV=1
MM1 pKa = 7.35KK2 pKa = 10.53NVVQILAVALISATAFSQTARR23 pKa = 11.84VNVIHH28 pKa = 6.73NSADD32 pKa = 3.24AAAEE36 pKa = 4.02QVDD39 pKa = 4.72VYY41 pKa = 11.36LDD43 pKa = 3.33AALALDD49 pKa = 3.61NFTFRR54 pKa = 11.84TEE56 pKa = 3.76SGFIDD61 pKa = 4.7FPAEE65 pKa = 3.8VEE67 pKa = 4.48VIIGVAPPNSTSSGDD82 pKa = 3.85AIASFPVTLMDD93 pKa = 3.78GEE95 pKa = 4.69TYY97 pKa = 10.38IVVADD102 pKa = 5.09GIVSPTGYY110 pKa = 10.92DD111 pKa = 3.53PIQPFSLEE119 pKa = 3.97VYY121 pKa = 10.86AMGRR125 pKa = 11.84EE126 pKa = 4.05TAAVATNTDD135 pKa = 3.5VLVHH139 pKa = 6.6HH140 pKa = 7.28GSTDD144 pKa = 3.2APTVDD149 pKa = 3.84VVEE152 pKa = 4.86TGAGAGTIVDD162 pKa = 4.23NITYY166 pKa = 10.19SEE168 pKa = 4.08FQGYY172 pKa = 10.11LEE174 pKa = 5.69LPTADD179 pKa = 3.21YY180 pKa = 10.88VLEE183 pKa = 4.19VRR185 pKa = 11.84DD186 pKa = 3.57EE187 pKa = 4.25TGTVGVAAYY196 pKa = 7.43EE197 pKa = 4.34APLATLNLDD206 pKa = 3.63GAALVVLASGFLNPANNSNGPAFGLWVSTGAPGALLEE243 pKa = 4.87LPSAALGVNDD253 pKa = 4.84FDD255 pKa = 3.6ITSFALYY262 pKa = 9.23PNPTTEE268 pKa = 3.94QLNVSVSGIEE278 pKa = 3.66LANYY282 pKa = 8.64NVSITDD288 pKa = 3.38MLGRR292 pKa = 11.84TVLSNLTVTDD302 pKa = 3.47NSVDD306 pKa = 3.44VTALHH311 pKa = 6.29GGIYY315 pKa = 9.61QLSIMDD321 pKa = 4.06GTTTIATKK329 pKa = 10.72KK330 pKa = 10.32FIKK333 pKa = 10.1QQ334 pKa = 3.07
MM1 pKa = 7.35KK2 pKa = 10.53NVVQILAVALISATAFSQTARR23 pKa = 11.84VNVIHH28 pKa = 6.73NSADD32 pKa = 3.24AAAEE36 pKa = 4.02QVDD39 pKa = 4.72VYY41 pKa = 11.36LDD43 pKa = 3.33AALALDD49 pKa = 3.61NFTFRR54 pKa = 11.84TEE56 pKa = 3.76SGFIDD61 pKa = 4.7FPAEE65 pKa = 3.8VEE67 pKa = 4.48VIIGVAPPNSTSSGDD82 pKa = 3.85AIASFPVTLMDD93 pKa = 3.78GEE95 pKa = 4.69TYY97 pKa = 10.38IVVADD102 pKa = 5.09GIVSPTGYY110 pKa = 10.92DD111 pKa = 3.53PIQPFSLEE119 pKa = 3.97VYY121 pKa = 10.86AMGRR125 pKa = 11.84EE126 pKa = 4.05TAAVATNTDD135 pKa = 3.5VLVHH139 pKa = 6.6HH140 pKa = 7.28GSTDD144 pKa = 3.2APTVDD149 pKa = 3.84VVEE152 pKa = 4.86TGAGAGTIVDD162 pKa = 4.23NITYY166 pKa = 10.19SEE168 pKa = 4.08FQGYY172 pKa = 10.11LEE174 pKa = 5.69LPTADD179 pKa = 3.21YY180 pKa = 10.88VLEE183 pKa = 4.19VRR185 pKa = 11.84DD186 pKa = 3.57EE187 pKa = 4.25TGTVGVAAYY196 pKa = 7.43EE197 pKa = 4.34APLATLNLDD206 pKa = 3.63GAALVVLASGFLNPANNSNGPAFGLWVSTGAPGALLEE243 pKa = 4.87LPSAALGVNDD253 pKa = 4.84FDD255 pKa = 3.6ITSFALYY262 pKa = 9.23PNPTTEE268 pKa = 3.94QLNVSVSGIEE278 pKa = 3.66LANYY282 pKa = 8.64NVSITDD288 pKa = 3.38MLGRR292 pKa = 11.84TVLSNLTVTDD302 pKa = 3.47NSVDD306 pKa = 3.44VTALHH311 pKa = 6.29GGIYY315 pKa = 9.61QLSIMDD321 pKa = 4.06GTTTIATKK329 pKa = 10.72KK330 pKa = 10.32FIKK333 pKa = 10.1QQ334 pKa = 3.07
Molecular weight: 34.78 kDa
Isoelectric point according different methods:
Protein with the highest isoelectric point:
>tr|A0A2N0ERL1|A0A2N0ERL1_9FLAO LuxR family two component transcriptional regulator OS=Ulvibacter sp. MAR_2010_11 OX=1250229 GN=ATE92_0867 PE=4 SV=1
MM1 pKa = 7.84PSGKK5 pKa = 9.32KK6 pKa = 9.59RR7 pKa = 11.84KK8 pKa = 7.05RR9 pKa = 11.84HH10 pKa = 5.11KK11 pKa = 10.59VATHH15 pKa = 5.21KK16 pKa = 10.3RR17 pKa = 11.84KK18 pKa = 9.62KK19 pKa = 9.04RR20 pKa = 11.84RR21 pKa = 11.84RR22 pKa = 11.84ANRR25 pKa = 11.84HH26 pKa = 4.5KK27 pKa = 10.78KK28 pKa = 9.37KK29 pKa = 10.83
MM1 pKa = 7.84PSGKK5 pKa = 9.32KK6 pKa = 9.59RR7 pKa = 11.84KK8 pKa = 7.05RR9 pKa = 11.84HH10 pKa = 5.11KK11 pKa = 10.59VATHH15 pKa = 5.21KK16 pKa = 10.3RR17 pKa = 11.84KK18 pKa = 9.62KK19 pKa = 9.04RR20 pKa = 11.84RR21 pKa = 11.84RR22 pKa = 11.84ANRR25 pKa = 11.84HH26 pKa = 4.5KK27 pKa = 10.78KK28 pKa = 9.37KK29 pKa = 10.83
Molecular weight: 3.63 kDa
Isoelectric point according different methods:
Peptides (in silico digests for buttom-up proteomics)
Below you can find in silico digests of the whole proteome with Trypsin, Chymotrypsin, Trypsin+LysC, LysN, ArgC proteases suitable for different mass spec machines.| Try ESI |
 |
|---|
| ChTry ESI |
 |
|---|
| ArgC ESI |
 |
|---|
| LysN ESI |
 |
|---|
| TryLysC ESI |
 |
|---|
| Try MALDI |
 |
|---|
| ChTry MALDI |
 |
|---|
| ArgC MALDI |
 |
|---|
| LysN MALDI |
 |
|---|
| TryLysC MALDI |
 |
|---|
| Try LTQ |
 |
|---|
| ChTry LTQ |
 |
|---|
| ArgC LTQ |
 |
|---|
| LysN LTQ |
 |
|---|
| TryLysC LTQ |
 |
|---|
| Try MSlow |
 |
|---|
| ChTry MSlow |
 |
|---|
| ArgC MSlow |
 |
|---|
| LysN MSlow |
 |
|---|
| TryLysC MSlow |
 |
|---|
| Try MShigh |
 |
|---|
| ChTry MShigh |
 |
|---|
| ArgC MShigh |
 |
|---|
| LysN MShigh |
 |
|---|
| TryLysC MShigh |
 |
|---|
General Statistics
Number of major isoforms |
Number of additional isoforms |
Number of all proteins |
Number of amino acids |
Min. Seq. Length |
Max. Seq. Length |
Avg. Seq. Length |
Avg. Mol. Weight |
|---|---|---|---|---|---|---|---|
0 |
915841 |
29 |
4170 |
335.1 |
37.57 |
Amino acid frequency
Ala |
Cys |
Asp |
Glu |
Phe |
Gly |
His |
Ile |
Lys |
Leu |
|---|---|---|---|---|---|---|---|---|---|
6.936 ± 0.044 | 0.766 ± 0.018 |
5.521 ± 0.046 | 6.674 ± 0.052 |
5.175 ± 0.033 | 6.74 ± 0.057 |
1.751 ± 0.022 | 7.655 ± 0.04 |
7.097 ± 0.079 | 9.245 ± 0.058 |
Met |
Asn |
Gln |
Pro |
Arg |
Ser |
Thr |
Val |
Trp |
Tyr |
|---|---|---|---|---|---|---|---|---|---|
2.219 ± 0.023 | 5.747 ± 0.04 |
3.557 ± 0.035 | 3.336 ± 0.026 |
3.505 ± 0.039 | 6.445 ± 0.03 |
6.133 ± 0.066 | 6.532 ± 0.044 |
1.019 ± 0.017 | 3.945 ± 0.03 |
Most of the basic statistics you can see at this page can be downloaded from this CSV file
Proteome-pI is available under Creative Commons Attribution-NoDerivs license, for more details see here
| Reference: Kozlowski LP. Proteome-pI 2.0: Proteome Isoelectric Point Database Update. Nucleic Acids Res. 2021, doi: 10.1093/nar/gkab944 | Contact: Lukasz P. Kozlowski |
