Streptococcus cuniculi
Taxonomy: cellular organisms; Bacteria; Terrabacteria group; Firmicutes; Bacilli; Lactobacillales; Streptococcaceae; Streptococcus
Average proteome isoelectric point is 6.06
Get precalculated fractions of proteins
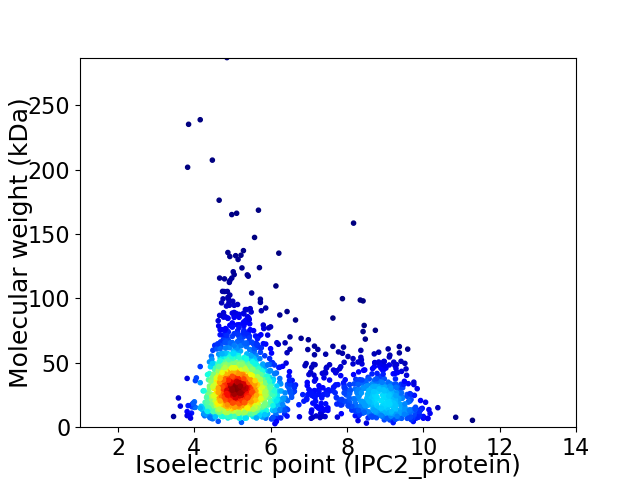
Virtual 2D-PAGE plot for 1969 proteins (isoelectric point calculated using IPC2_protein)
Get csv file with sequences according to given criteria:
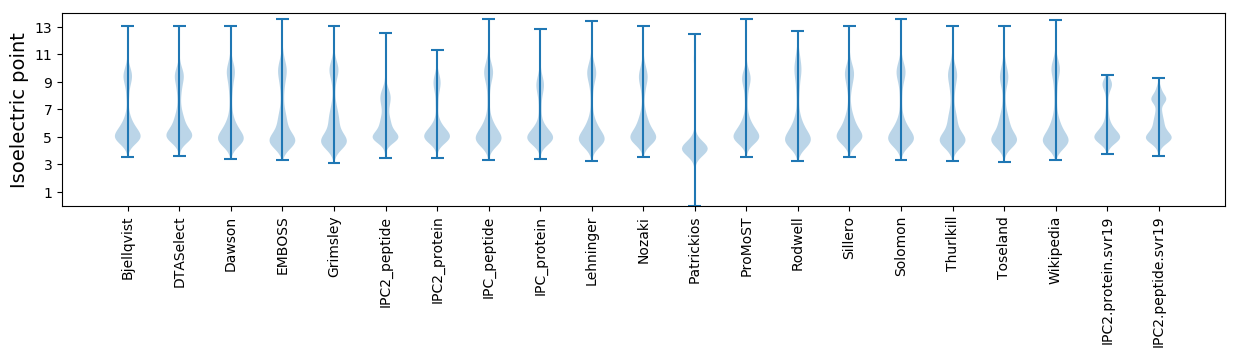
* You can choose from 21 different methods for calculating isoelectric point
Summary statistics related to proteome-wise predictions
Protein with the lowest isoelectric point:
>tr|A0A1Q8EAG3|A0A1Q8EAG3_9STRE DNA replication protein DnaD OS=Streptococcus cuniculi OX=1432788 GN=BU202_00385 PE=4 SV=1
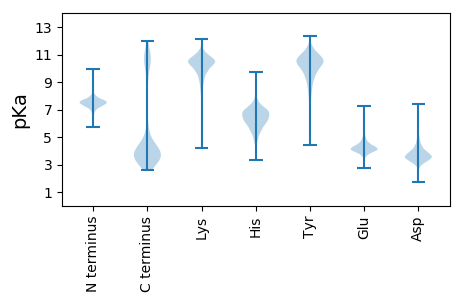
MM1 pKa = 7.7NITLYY6 pKa = 10.19PEE8 pKa = 3.91KK9 pKa = 10.64CIACGLCQTMSDD21 pKa = 3.55VFDD24 pKa = 4.63YY25 pKa = 11.3DD26 pKa = 3.73DD27 pKa = 5.04DD28 pKa = 6.36GIVLFADD35 pKa = 3.75DD36 pKa = 4.73HH37 pKa = 5.91QASTMTLSDD46 pKa = 3.41RR47 pKa = 11.84TDD49 pKa = 3.13ALLAAKK55 pKa = 9.89SCPTKK60 pKa = 10.62AISVDD65 pKa = 3.28
MM1 pKa = 7.7NITLYY6 pKa = 10.19PEE8 pKa = 3.91KK9 pKa = 10.64CIACGLCQTMSDD21 pKa = 3.55VFDD24 pKa = 4.63YY25 pKa = 11.3DD26 pKa = 3.73DD27 pKa = 5.04DD28 pKa = 6.36GIVLFADD35 pKa = 3.75DD36 pKa = 4.73HH37 pKa = 5.91QASTMTLSDD46 pKa = 3.41RR47 pKa = 11.84TDD49 pKa = 3.13ALLAAKK55 pKa = 9.89SCPTKK60 pKa = 10.62AISVDD65 pKa = 3.28
Molecular weight: 7.05 kDa
Isoelectric point according different methods:
Protein with the highest isoelectric point:
>tr|A0A1Q8E733|A0A1Q8E733_9STRE Membrane protein insertase YidC OS=Streptococcus cuniculi OX=1432788 GN=yidC PE=3 SV=1
MM1 pKa = 7.45KK2 pKa = 9.59RR3 pKa = 11.84TFQPSKK9 pKa = 9.26IRR11 pKa = 11.84RR12 pKa = 11.84ARR14 pKa = 11.84KK15 pKa = 8.35HH16 pKa = 4.78GFRR19 pKa = 11.84NRR21 pKa = 11.84MSTKK25 pKa = 9.22NGRR28 pKa = 11.84RR29 pKa = 11.84VLAARR34 pKa = 11.84RR35 pKa = 11.84RR36 pKa = 11.84KK37 pKa = 8.78GRR39 pKa = 11.84KK40 pKa = 8.38VLAVAA45 pKa = 4.94
MM1 pKa = 7.45KK2 pKa = 9.59RR3 pKa = 11.84TFQPSKK9 pKa = 9.26IRR11 pKa = 11.84RR12 pKa = 11.84ARR14 pKa = 11.84KK15 pKa = 8.35HH16 pKa = 4.78GFRR19 pKa = 11.84NRR21 pKa = 11.84MSTKK25 pKa = 9.22NGRR28 pKa = 11.84RR29 pKa = 11.84VLAARR34 pKa = 11.84RR35 pKa = 11.84RR36 pKa = 11.84KK37 pKa = 8.78GRR39 pKa = 11.84KK40 pKa = 8.38VLAVAA45 pKa = 4.94
Molecular weight: 5.35 kDa
Isoelectric point according different methods:
Peptides (in silico digests for buttom-up proteomics)
Below you can find in silico digests of the whole proteome with Trypsin, Chymotrypsin, Trypsin+LysC, LysN, ArgC proteases suitable for different mass spec machines.| Try ESI |
 |
|---|
| ChTry ESI |
|
|---|
| ArgC ESI |
|
|---|
| LysN ESI |
|
|---|
| TryLysC ESI |
|
|---|
| Try MALDI |
|
|---|
| ChTry MALDI |
|
|---|
| ArgC MALDI |
|
|---|
| LysN MALDI |
|
|---|
| TryLysC MALDI |
|
|---|
| Try LTQ |
|
|---|
| ChTry LTQ |
|
|---|
| ArgC LTQ |
|
|---|
| LysN LTQ |
|
|---|
| TryLysC LTQ |
|
|---|
| Try MSlow |
|
|---|
| ChTry MSlow |
|
|---|
| ArgC MSlow |
|
|---|
| LysN MSlow |
|
|---|
| TryLysC MSlow |
|
|---|
| Try MShigh |
|
|---|
| ChTry MShigh |
|
|---|
| ArgC MShigh |
|
|---|
| LysN MShigh |
|
|---|
| TryLysC MShigh |
|
|---|
General Statistics
Number of major isoforms |
Number of additional isoforms |
Number of all proteins |
Number of amino acids |
Min. Seq. Length |
Max. Seq. Length |
Avg. Seq. Length |
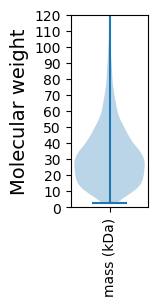
Avg. Mol. Weight |
|---|---|---|---|---|---|---|---|
0 |
604276 |
23 |
2634 |
306.9 |
34.32 |
Amino acid frequency
Ala |
Cys |
Asp |
Glu |
Phe |
Gly |
His |
Ile |
Lys |
Leu |
|---|---|---|---|---|---|---|---|---|---|
8.135 ± 0.066 | 0.584 ± 0.014 |
5.6 ± 0.065 | 7.189 ± 0.067 |
4.426 ± 0.043 | 6.727 ± 0.055 |
2.014 ± 0.027 | 7.023 ± 0.057 |
6.146 ± 0.051 | 10.12 ± 0.08 |
Met |
Asn |
Gln |
Pro |
Arg |
Ser |
Thr |
Val |
Trp |
Tyr |
|---|---|---|---|---|---|---|---|---|---|
2.571 ± 0.029 | 3.932 ± 0.033 |
3.457 ± 0.043 | 4.241 ± 0.051 |
4.205 ± 0.046 | 5.883 ± 0.054 |
5.785 ± 0.063 | 7.26 ± 0.057 |
0.929 ± 0.02 | 3.775 ± 0.033 |
Most of the basic statistics you can see at this page can be downloaded from this CSV file
See this proteome in:

Proteome-pI is available under Creative Commons Attribution-NoDerivs license, for more details see here
| Reference: Kozlowski LP. Proteome-pI 2.0: Proteome Isoelectric Point Database Update. Nucleic Acids Res. 2021, doi: 10.1093/nar/gkab944 | Contact: Lukasz P. Kozlowski |