Erwinia phage vB_EamP-L1
Taxonomy: Viruses; Duplodnaviria; Heunggongvirae; Uroviricota; Caudoviricetes; Caudovirales; Autographiviridae; Studiervirinae; Elunavirus; Erwinia virus L1
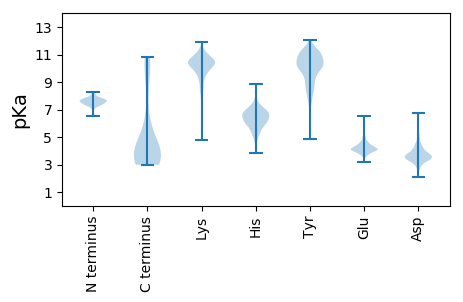
Average proteome isoelectric point is 6.74
Get precalculated fractions of proteins

Virtual 2D-PAGE plot for 51 proteins (isoelectric point calculated using IPC2_protein)
Get csv file with sequences according to given criteria:
* You can choose from 21 different methods for calculating isoelectric point
Summary statistics related to proteome-wise predictions


Protein with the lowest isoelectric point:
>tr|G0YQ77|G0YQ77_9CAUD Gp13.5 OS=Erwinia phage vB_EamP-L1 OX=1051673 PE=4 SV=1
MM1 pKa = 7.9ADD3 pKa = 3.39SFLNPADD10 pKa = 4.05EE11 pKa = 5.14LDD13 pKa = 4.69AINDD17 pKa = 3.39ILASIGEE24 pKa = 4.38APVLTLGDD32 pKa = 3.93SANVDD37 pKa = 3.18VSNAQQILSKK47 pKa = 9.54VNRR50 pKa = 11.84MIQSKK55 pKa = 9.52GWTFNIEE62 pKa = 3.77EE63 pKa = 4.53GAVLVPDD70 pKa = 4.25VNTGLIPYY78 pKa = 8.62LPSYY82 pKa = 10.74LRR84 pKa = 11.84VQGADD89 pKa = 3.26SPNTYY94 pKa = 10.03INRR97 pKa = 11.84QGYY100 pKa = 9.53VYY102 pKa = 9.51DD103 pKa = 3.84TAGLTDD109 pKa = 3.78VFQGSISVNLTRR121 pKa = 11.84LRR123 pKa = 11.84EE124 pKa = 4.0YY125 pKa = 11.23SEE127 pKa = 4.23MPQCFRR133 pKa = 11.84SYY135 pKa = 10.7IVTKK139 pKa = 10.66ASRR142 pKa = 11.84QFNMRR147 pKa = 11.84YY148 pKa = 9.83FGDD151 pKa = 3.7TAIEE155 pKa = 4.4SILAEE160 pKa = 4.33EE161 pKa = 4.04EE162 pKa = 3.99AEE164 pKa = 6.0AYY166 pKa = 7.38MQCNEE171 pKa = 4.04YY172 pKa = 10.61EE173 pKa = 3.91LDD175 pKa = 3.59YY176 pKa = 11.67GKK178 pKa = 11.11FNMLDD183 pKa = 2.89GDD185 pKa = 4.29AFVQGILSRR194 pKa = 3.97
MM1 pKa = 7.9ADD3 pKa = 3.39SFLNPADD10 pKa = 4.05EE11 pKa = 5.14LDD13 pKa = 4.69AINDD17 pKa = 3.39ILASIGEE24 pKa = 4.38APVLTLGDD32 pKa = 3.93SANVDD37 pKa = 3.18VSNAQQILSKK47 pKa = 9.54VNRR50 pKa = 11.84MIQSKK55 pKa = 9.52GWTFNIEE62 pKa = 3.77EE63 pKa = 4.53GAVLVPDD70 pKa = 4.25VNTGLIPYY78 pKa = 8.62LPSYY82 pKa = 10.74LRR84 pKa = 11.84VQGADD89 pKa = 3.26SPNTYY94 pKa = 10.03INRR97 pKa = 11.84QGYY100 pKa = 9.53VYY102 pKa = 9.51DD103 pKa = 3.84TAGLTDD109 pKa = 3.78VFQGSISVNLTRR121 pKa = 11.84LRR123 pKa = 11.84EE124 pKa = 4.0YY125 pKa = 11.23SEE127 pKa = 4.23MPQCFRR133 pKa = 11.84SYY135 pKa = 10.7IVTKK139 pKa = 10.66ASRR142 pKa = 11.84QFNMRR147 pKa = 11.84YY148 pKa = 9.83FGDD151 pKa = 3.7TAIEE155 pKa = 4.4SILAEE160 pKa = 4.33EE161 pKa = 4.04EE162 pKa = 3.99AEE164 pKa = 6.0AYY166 pKa = 7.38MQCNEE171 pKa = 4.04YY172 pKa = 10.61EE173 pKa = 3.91LDD175 pKa = 3.59YY176 pKa = 11.67GKK178 pKa = 11.11FNMLDD183 pKa = 2.89GDD185 pKa = 4.29AFVQGILSRR194 pKa = 3.97
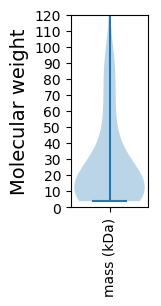
Molecular weight: 21.6 kDa
Isoelectric point according different methods:
Protein with the highest isoelectric point:
>tr|G0YQ52|G0YQ52_9CAUD Gp1.6 OS=Erwinia phage vB_EamP-L1 OX=1051673 PE=4 SV=1
MM1 pKa = 7.45EE2 pKa = 6.3AYY4 pKa = 7.73DD5 pKa = 4.06TQPSASSEE13 pKa = 4.03EE14 pKa = 4.04LRR16 pKa = 11.84LIPLRR21 pKa = 11.84KK22 pKa = 9.42YY23 pKa = 10.25KK24 pKa = 10.58YY25 pKa = 10.28NPASPSGLIFARR37 pKa = 11.84SGKK40 pKa = 9.6PCGTLRR46 pKa = 11.84KK47 pKa = 9.66DD48 pKa = 4.55GYY50 pKa = 10.49WSTQSRR56 pKa = 11.84KK57 pKa = 10.14KK58 pKa = 10.33NLQVHH63 pKa = 5.7RR64 pKa = 11.84LVWIANFGAIPPGMEE79 pKa = 3.81IDD81 pKa = 4.36HH82 pKa = 7.24IDD84 pKa = 3.62RR85 pKa = 11.84NPSNNLIEE93 pKa = 4.11NLRR96 pKa = 11.84LVSRR100 pKa = 11.84SQNGFNRR107 pKa = 11.84RR108 pKa = 11.84VPRR111 pKa = 11.84QSQTGQRR118 pKa = 11.84YY119 pKa = 7.8IHH121 pKa = 6.09TCRR124 pKa = 11.84KK125 pKa = 7.54TGNFTVRR132 pKa = 11.84IARR135 pKa = 11.84VSYY138 pKa = 8.41GTFPTLEE145 pKa = 3.97EE146 pKa = 4.04ALEE149 pKa = 4.16VRR151 pKa = 11.84DD152 pKa = 4.55SLIKK156 pKa = 9.2THH158 pKa = 6.55
MM1 pKa = 7.45EE2 pKa = 6.3AYY4 pKa = 7.73DD5 pKa = 4.06TQPSASSEE13 pKa = 4.03EE14 pKa = 4.04LRR16 pKa = 11.84LIPLRR21 pKa = 11.84KK22 pKa = 9.42YY23 pKa = 10.25KK24 pKa = 10.58YY25 pKa = 10.28NPASPSGLIFARR37 pKa = 11.84SGKK40 pKa = 9.6PCGTLRR46 pKa = 11.84KK47 pKa = 9.66DD48 pKa = 4.55GYY50 pKa = 10.49WSTQSRR56 pKa = 11.84KK57 pKa = 10.14KK58 pKa = 10.33NLQVHH63 pKa = 5.7RR64 pKa = 11.84LVWIANFGAIPPGMEE79 pKa = 3.81IDD81 pKa = 4.36HH82 pKa = 7.24IDD84 pKa = 3.62RR85 pKa = 11.84NPSNNLIEE93 pKa = 4.11NLRR96 pKa = 11.84LVSRR100 pKa = 11.84SQNGFNRR107 pKa = 11.84RR108 pKa = 11.84VPRR111 pKa = 11.84QSQTGQRR118 pKa = 11.84YY119 pKa = 7.8IHH121 pKa = 6.09TCRR124 pKa = 11.84KK125 pKa = 7.54TGNFTVRR132 pKa = 11.84IARR135 pKa = 11.84VSYY138 pKa = 8.41GTFPTLEE145 pKa = 3.97EE146 pKa = 4.04ALEE149 pKa = 4.16VRR151 pKa = 11.84DD152 pKa = 4.55SLIKK156 pKa = 9.2THH158 pKa = 6.55
Molecular weight: 18.09 kDa
Isoelectric point according different methods:
Peptides (in silico digests for buttom-up proteomics)
Below you can find in silico digests of the whole proteome with Trypsin, Chymotrypsin, Trypsin+LysC, LysN, ArgC proteases suitable for different mass spec machines.| Try ESI |
 |
|---|
| ChTry ESI |
 |
|---|
| ArgC ESI |
 |
|---|
| LysN ESI |
 |
|---|
| TryLysC ESI |
 |
|---|
| Try MALDI |
 |
|---|
| ChTry MALDI |
 |
|---|
| ArgC MALDI |
 |
|---|
| LysN MALDI |
 |
|---|
| TryLysC MALDI |
 |
|---|
| Try LTQ |
 |
|---|
| ChTry LTQ |
 |
|---|
| ArgC LTQ |
 |
|---|
| LysN LTQ |
 |
|---|
| TryLysC LTQ |
 |
|---|
| Try MSlow |
 |
|---|
| ChTry MSlow |
 |
|---|
| ArgC MSlow |
 |
|---|
| LysN MSlow |
 |
|---|
| TryLysC MSlow |
 |
|---|
| Try MShigh |
 |
|---|
| ChTry MShigh |
 |
|---|
| ArgC MShigh |
 |
|---|
| LysN MShigh |
 |
|---|
| TryLysC MShigh |
 |
|---|
General Statistics
Number of major isoforms |
Number of additional isoforms |
Number of all proteins |
Number of amino acids |
Min. Seq. Length |
Max. Seq. Length |
Avg. Seq. Length |
Avg. Mol. Weight |
|---|---|---|---|---|---|---|---|
0 |
13043 |
33 |
1331 |
255.7 |
28.31 |
Amino acid frequency
Ala |
Cys |
Asp |
Glu |
Phe |
Gly |
His |
Ile |
Lys |
Leu |
|---|---|---|---|---|---|---|---|---|---|
9.668 ± 0.518 | 0.997 ± 0.171 |
6.463 ± 0.29 | 6.272 ± 0.342 |
3.718 ± 0.198 | 7.92 ± 0.319 |
1.809 ± 0.168 | 4.999 ± 0.178 |
6.325 ± 0.338 | 7.997 ± 0.299 |
Met |
Asn |
Gln |
Pro |
Arg |
Ser |
Thr |
Val |
Trp |
Tyr |
|---|---|---|---|---|---|---|---|---|---|
2.929 ± 0.2 | 4.293 ± 0.172 |
3.665 ± 0.164 | 4.47 ± 0.294 |
5.428 ± 0.173 | 6.149 ± 0.338 |
5.727 ± 0.262 | 6.709 ± 0.297 |
1.388 ± 0.182 | 3.074 ± 0.18 |
Most of the basic statistics you can see at this page can be downloaded from this CSV file
Proteome-pI is available under Creative Commons Attribution-NoDerivs license, for more details see here
| Reference: Kozlowski LP. Proteome-pI 2.0: Proteome Isoelectric Point Database Update. Nucleic Acids Res. 2021, doi: 10.1093/nar/gkab944 | Contact: Lukasz P. Kozlowski |
