Prauserella sp. YIM 121212
Taxonomy: cellular organisms; Bacteria; Terrabacteria group; Actinobacteria; Actinomycetia; Pseudonocardiales; Pseudonocardiaceae; Prauserella; unclassified Prauserella
Average proteome isoelectric point is 6.15
Get precalculated fractions of proteins

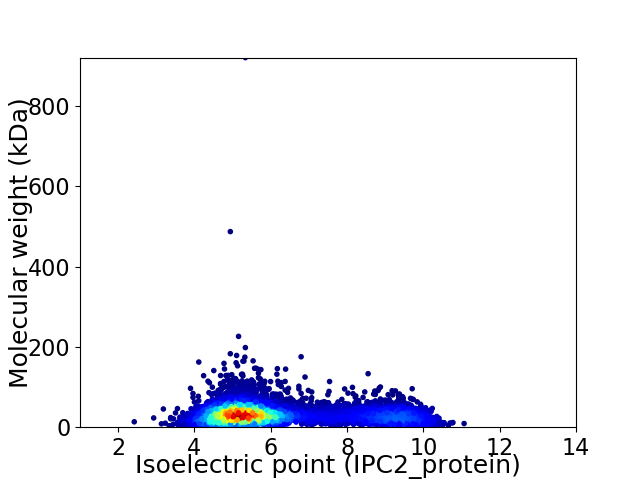
Virtual 2D-PAGE plot for 7493 proteins (isoelectric point calculated using IPC2_protein)
Get csv file with sequences according to given criteria:
* You can choose from 21 different methods for calculating isoelectric point
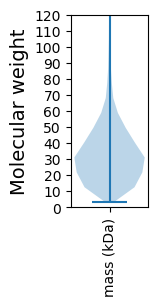
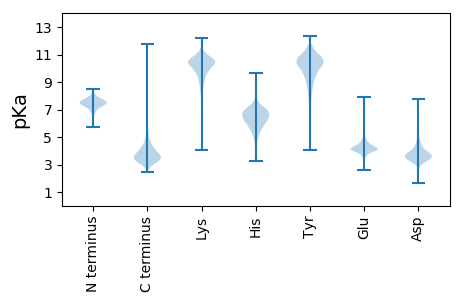
Summary statistics related to proteome-wise predictions


Protein with the lowest isoelectric point:
>tr|A0A318LSR3|A0A318LSR3_9PSEU ABC transporter substrate-binding protein OS=Prauserella sp. YIM 121212 OX=1477506 GN=BA062_14890 PE=4 SV=1
MM1 pKa = 7.56LGIVLLGLVSGCAGEE16 pKa = 4.49DD17 pKa = 3.42LSRR20 pKa = 11.84SNYY23 pKa = 9.25QRR25 pKa = 11.84TTVTAEE31 pKa = 3.83AGSGQGEE38 pKa = 4.7VPSGPITDD46 pKa = 3.91PAFGLSALRR55 pKa = 11.84SVDD58 pKa = 3.29PCALLSGDD66 pKa = 4.11VIGDD70 pKa = 4.27LGTVSDD76 pKa = 4.58EE77 pKa = 4.49PYY79 pKa = 8.8EE80 pKa = 4.38SEE82 pKa = 3.83WGSCRR87 pKa = 11.84VDD89 pKa = 3.32VQDD92 pKa = 5.05AGGKK96 pKa = 7.41TIEE99 pKa = 4.34VGVDD103 pKa = 3.13LGGSPMGSDD112 pKa = 3.18PTGAIEE118 pKa = 4.9GLPFLEE124 pKa = 5.02NKK126 pKa = 10.43LDD128 pKa = 3.73DD129 pKa = 3.87TTCYY133 pKa = 9.42STAIYY138 pKa = 9.65SQQPPLGVTVQTGYY152 pKa = 11.1EE153 pKa = 4.16GGNPCDD159 pKa = 3.23VGYY162 pKa = 7.22TTLQQVVRR170 pKa = 11.84ALRR173 pKa = 11.84AEE175 pKa = 3.93PAKK178 pKa = 10.64YY179 pKa = 9.82DD180 pKa = 3.66VPAGSLLEE188 pKa = 4.53ADD190 pKa = 4.2PCASADD196 pKa = 3.76EE197 pKa = 4.7GVLAQVLGGSPSRR210 pKa = 11.84MAMGLHH216 pKa = 6.36ACDD219 pKa = 4.65LSFGTDD225 pKa = 3.16PTISVRR231 pKa = 11.84FRR233 pKa = 11.84AGYY236 pKa = 9.3PPDD239 pKa = 3.67TSDD242 pKa = 4.18GGTEE246 pKa = 3.61VDD248 pKa = 3.81LGGGVKK254 pKa = 10.43AIQEE258 pKa = 4.32PGSTDD263 pKa = 3.09TAEE266 pKa = 5.01CSVEE270 pKa = 4.12WVHH273 pKa = 7.27LPGEE277 pKa = 4.36DD278 pKa = 4.74DD279 pKa = 4.15ANEE282 pKa = 4.14LATVDD287 pKa = 3.86YY288 pKa = 11.35YY289 pKa = 11.43DD290 pKa = 4.5YY291 pKa = 11.74NDD293 pKa = 4.3GASKK297 pKa = 11.06DD298 pKa = 3.98DD299 pKa = 3.42ACARR303 pKa = 11.84ALEE306 pKa = 4.45VAKK309 pKa = 10.7SVAPKK314 pKa = 10.36LPKK317 pKa = 10.27AA318 pKa = 3.96
MM1 pKa = 7.56LGIVLLGLVSGCAGEE16 pKa = 4.49DD17 pKa = 3.42LSRR20 pKa = 11.84SNYY23 pKa = 9.25QRR25 pKa = 11.84TTVTAEE31 pKa = 3.83AGSGQGEE38 pKa = 4.7VPSGPITDD46 pKa = 3.91PAFGLSALRR55 pKa = 11.84SVDD58 pKa = 3.29PCALLSGDD66 pKa = 4.11VIGDD70 pKa = 4.27LGTVSDD76 pKa = 4.58EE77 pKa = 4.49PYY79 pKa = 8.8EE80 pKa = 4.38SEE82 pKa = 3.83WGSCRR87 pKa = 11.84VDD89 pKa = 3.32VQDD92 pKa = 5.05AGGKK96 pKa = 7.41TIEE99 pKa = 4.34VGVDD103 pKa = 3.13LGGSPMGSDD112 pKa = 3.18PTGAIEE118 pKa = 4.9GLPFLEE124 pKa = 5.02NKK126 pKa = 10.43LDD128 pKa = 3.73DD129 pKa = 3.87TTCYY133 pKa = 9.42STAIYY138 pKa = 9.65SQQPPLGVTVQTGYY152 pKa = 11.1EE153 pKa = 4.16GGNPCDD159 pKa = 3.23VGYY162 pKa = 7.22TTLQQVVRR170 pKa = 11.84ALRR173 pKa = 11.84AEE175 pKa = 3.93PAKK178 pKa = 10.64YY179 pKa = 9.82DD180 pKa = 3.66VPAGSLLEE188 pKa = 4.53ADD190 pKa = 4.2PCASADD196 pKa = 3.76EE197 pKa = 4.7GVLAQVLGGSPSRR210 pKa = 11.84MAMGLHH216 pKa = 6.36ACDD219 pKa = 4.65LSFGTDD225 pKa = 3.16PTISVRR231 pKa = 11.84FRR233 pKa = 11.84AGYY236 pKa = 9.3PPDD239 pKa = 3.67TSDD242 pKa = 4.18GGTEE246 pKa = 3.61VDD248 pKa = 3.81LGGGVKK254 pKa = 10.43AIQEE258 pKa = 4.32PGSTDD263 pKa = 3.09TAEE266 pKa = 5.01CSVEE270 pKa = 4.12WVHH273 pKa = 7.27LPGEE277 pKa = 4.36DD278 pKa = 4.74DD279 pKa = 4.15ANEE282 pKa = 4.14LATVDD287 pKa = 3.86YY288 pKa = 11.35YY289 pKa = 11.43DD290 pKa = 4.5YY291 pKa = 11.74NDD293 pKa = 4.3GASKK297 pKa = 11.06DD298 pKa = 3.98DD299 pKa = 3.42ACARR303 pKa = 11.84ALEE306 pKa = 4.45VAKK309 pKa = 10.7SVAPKK314 pKa = 10.36LPKK317 pKa = 10.27AA318 pKa = 3.96
Molecular weight: 32.68 kDa
Isoelectric point according different methods:
Protein with the highest isoelectric point:
>tr|A0A318LUH6|A0A318LUH6_9PSEU Betaine-aldehyde dehydrogenase OS=Prauserella sp. YIM 121212 OX=1477506 GN=BA062_11470 PE=3 SV=1
MM1 pKa = 7.67RR2 pKa = 11.84RR3 pKa = 11.84TRR5 pKa = 11.84TSATWIGVIVFTAVLVLLLIFILQNTQSVQISYY38 pKa = 10.49FGATGHH44 pKa = 6.08VSLAVAMLLAAVAGVLLTAIAGSLRR69 pKa = 11.84IWQLRR74 pKa = 11.84RR75 pKa = 11.84RR76 pKa = 11.84LRR78 pKa = 11.84GVTRR82 pKa = 11.84RR83 pKa = 3.58
MM1 pKa = 7.67RR2 pKa = 11.84RR3 pKa = 11.84TRR5 pKa = 11.84TSATWIGVIVFTAVLVLLLIFILQNTQSVQISYY38 pKa = 10.49FGATGHH44 pKa = 6.08VSLAVAMLLAAVAGVLLTAIAGSLRR69 pKa = 11.84IWQLRR74 pKa = 11.84RR75 pKa = 11.84RR76 pKa = 11.84LRR78 pKa = 11.84GVTRR82 pKa = 11.84RR83 pKa = 3.58
Molecular weight: 9.14 kDa
Isoelectric point according different methods:
Peptides (in silico digests for buttom-up proteomics)
Below you can find in silico digests of the whole proteome with Trypsin, Chymotrypsin, Trypsin+LysC, LysN, ArgC proteases suitable for different mass spec machines.| Try ESI |
 |
|---|
| ChTry ESI |
 |
|---|
| ArgC ESI |
 |
|---|
| LysN ESI |
 |
|---|
| TryLysC ESI |
 |
|---|
| Try MALDI |
 |
|---|
| ChTry MALDI |
 |
|---|
| ArgC MALDI |
 |
|---|
| LysN MALDI |
 |
|---|
| TryLysC MALDI |
 |
|---|
| Try LTQ |
 |
|---|
| ChTry LTQ |
 |
|---|
| ArgC LTQ |
 |
|---|
| LysN LTQ |
 |
|---|
| TryLysC LTQ |
 |
|---|
| Try MSlow |
 |
|---|
| ChTry MSlow |
 |
|---|
| ArgC MSlow |
 |
|---|
| LysN MSlow |
 |
|---|
| TryLysC MSlow |
 |
|---|
| Try MShigh |
 |
|---|
| ChTry MShigh |
 |
|---|
| ArgC MShigh |
 |
|---|
| LysN MShigh |
 |
|---|
| TryLysC MShigh |
 |
|---|
General Statistics
Number of major isoforms |
Number of additional isoforms |
Number of all proteins |
Number of amino acids |
Min. Seq. Length |
Max. Seq. Length |
Avg. Seq. Length |
Avg. Mol. Weight |
|---|---|---|---|---|---|---|---|
0 |
2375979 |
29 |
8675 |
317.1 |
33.98 |
Amino acid frequency
Ala |
Cys |
Asp |
Glu |
Phe |
Gly |
His |
Ile |
Lys |
Leu |
|---|---|---|---|---|---|---|---|---|---|
13.319 ± 0.041 | 0.77 ± 0.008 |
5.881 ± 0.024 | 6.058 ± 0.025 |
2.874 ± 0.015 | 9.437 ± 0.028 |
2.207 ± 0.017 | 3.423 ± 0.021 |
1.912 ± 0.018 | 10.719 ± 0.037 |
Met |
Asn |
Gln |
Pro |
Arg |
Ser |
Thr |
Val |
Trp |
Tyr |
|---|---|---|---|---|---|---|---|---|---|
1.678 ± 0.012 | 1.803 ± 0.013 |
5.83 ± 0.026 | 2.646 ± 0.016 |
8.058 ± 0.032 | 4.965 ± 0.016 |
5.929 ± 0.02 | 9.016 ± 0.028 |
1.473 ± 0.011 | 2.003 ± 0.014 |
Most of the basic statistics you can see at this page can be downloaded from this CSV file
Proteome-pI is available under Creative Commons Attribution-NoDerivs license, for more details see here
| Reference: Kozlowski LP. Proteome-pI 2.0: Proteome Isoelectric Point Database Update. Nucleic Acids Res. 2021, doi: 10.1093/nar/gkab944 | Contact: Lukasz P. Kozlowski |
