Cephus cinctus (Wheat stem sawfly)
Taxonomy: cellular organisms; Eukaryota; Opisthokonta; Metazoa; Eumetazoa; Bilateria; Protostomia; Ecdysozoa; Panarthropoda; Arthropoda; Mandibulata; Pancrustacea; Hexapoda; Insecta; Dicondylia; Pterygota; Neoptera; Endopterygota; Hymenoptera; Cephoidea; Cephidae; Cephus
Average proteome isoelectric point is 7.33
Get precalculated fractions of proteins

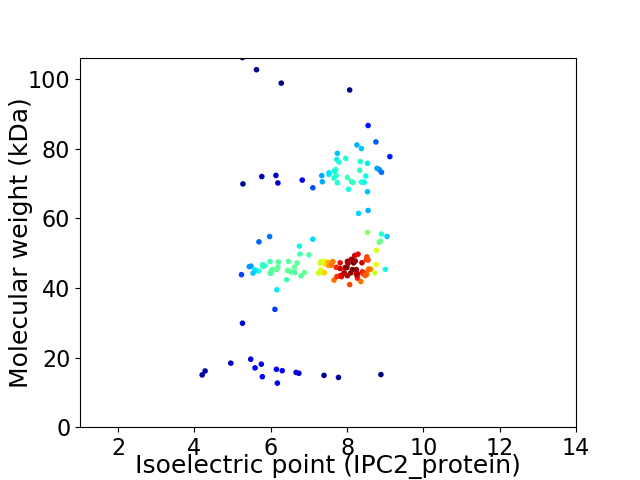
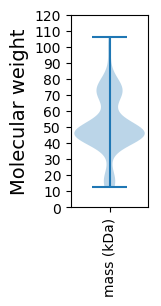
Virtual 2D-PAGE plot for 160 proteins (isoelectric point calculated using IPC2_protein)
Get csv file with sequences according to given criteria:
* You can choose from 21 different methods for calculating isoelectric point
Summary statistics related to proteome-wise predictions


Protein with the lowest isoelectric point:
>tr|A0A3L9LTS5|A0A3L9LTS5_CEPCN Gustatory receptor OS=Cephus cinctus OX=211228 GN=Gr8 PE=3 SV=1
MM1 pKa = 7.58LLYY4 pKa = 9.81VCCVFFLLGFGNSHH18 pKa = 5.85GVSDD22 pKa = 5.16EE23 pKa = 3.97MMEE26 pKa = 4.17MAKK29 pKa = 9.18MLHH32 pKa = 6.7DD33 pKa = 4.07SCVSEE38 pKa = 4.12TGVDD42 pKa = 2.96EE43 pKa = 5.16GLIEE47 pKa = 4.1KK48 pKa = 10.46CRR50 pKa = 11.84DD51 pKa = 3.19GVFTEE56 pKa = 4.88DD57 pKa = 4.84SNLKK61 pKa = 10.5CYY63 pKa = 9.97IKK65 pKa = 10.55CIMDD69 pKa = 3.55QVSGMTDD76 pKa = 3.04DD77 pKa = 5.1GEE79 pKa = 4.34VDD81 pKa = 3.69EE82 pKa = 4.73EE83 pKa = 4.88TVISMLPEE91 pKa = 4.06EE92 pKa = 4.84MQSEE96 pKa = 4.42TAPTIRR102 pKa = 11.84EE103 pKa = 4.21CGTVRR108 pKa = 11.84GSDD111 pKa = 3.34NCDD114 pKa = 2.75TAFQTHH120 pKa = 5.23KK121 pKa = 10.37CYY123 pKa = 10.13YY124 pKa = 10.01AKK126 pKa = 10.8NPEE129 pKa = 3.95NYY131 pKa = 10.13FLVV134 pKa = 3.87
MM1 pKa = 7.58LLYY4 pKa = 9.81VCCVFFLLGFGNSHH18 pKa = 5.85GVSDD22 pKa = 5.16EE23 pKa = 3.97MMEE26 pKa = 4.17MAKK29 pKa = 9.18MLHH32 pKa = 6.7DD33 pKa = 4.07SCVSEE38 pKa = 4.12TGVDD42 pKa = 2.96EE43 pKa = 5.16GLIEE47 pKa = 4.1KK48 pKa = 10.46CRR50 pKa = 11.84DD51 pKa = 3.19GVFTEE56 pKa = 4.88DD57 pKa = 4.84SNLKK61 pKa = 10.5CYY63 pKa = 9.97IKK65 pKa = 10.55CIMDD69 pKa = 3.55QVSGMTDD76 pKa = 3.04DD77 pKa = 5.1GEE79 pKa = 4.34VDD81 pKa = 3.69EE82 pKa = 4.73EE83 pKa = 4.88TVISMLPEE91 pKa = 4.06EE92 pKa = 4.84MQSEE96 pKa = 4.42TAPTIRR102 pKa = 11.84EE103 pKa = 4.21CGTVRR108 pKa = 11.84GSDD111 pKa = 3.34NCDD114 pKa = 2.75TAFQTHH120 pKa = 5.23KK121 pKa = 10.37CYY123 pKa = 10.13YY124 pKa = 10.01AKK126 pKa = 10.8NPEE129 pKa = 3.95NYY131 pKa = 10.13FLVV134 pKa = 3.87
Molecular weight: 15.02 kDa
Isoelectric point according different methods:
Protein with the highest isoelectric point:
>tr|A0A3L9LSS8|A0A3L9LSS8_CEPCN Ionotropic receptor 136 OS=Cephus cinctus OX=211228 GN=Ir136 PE=4 SV=1
MM1 pKa = 7.46KK2 pKa = 10.21ALEE5 pKa = 4.47GFSRR9 pKa = 11.84ILITFIVAVMVIVKK23 pKa = 10.36ADD25 pKa = 3.05IRR27 pKa = 11.84RR28 pKa = 11.84DD29 pKa = 3.41CRR31 pKa = 11.84KK32 pKa = 9.84QSGVSWAALKK42 pKa = 10.48KK43 pKa = 10.45LRR45 pKa = 11.84AGDD48 pKa = 4.25FNQEE52 pKa = 3.82DD53 pKa = 4.34HH54 pKa = 7.4SVKK57 pKa = 10.54CYY59 pKa = 10.42LKK61 pKa = 10.86CFMVKK66 pKa = 10.25NGIMSEE72 pKa = 4.04DD73 pKa = 3.75NYY75 pKa = 10.86VDD77 pKa = 3.0VDD79 pKa = 3.25KK80 pKa = 11.18ALRR83 pKa = 11.84HH84 pKa = 5.9LPRR87 pKa = 11.84KK88 pKa = 9.07LQEE91 pKa = 3.79PSRR94 pKa = 11.84KK95 pKa = 9.05ILARR99 pKa = 11.84CKK101 pKa = 10.64DD102 pKa = 3.49SAGKK106 pKa = 10.06DD107 pKa = 3.4SCDD110 pKa = 3.79KK111 pKa = 10.87AFQIAKK117 pKa = 9.7CYY119 pKa = 9.93FKK121 pKa = 10.85SQPGILKK128 pKa = 10.08NVSFVV133 pKa = 3.12
MM1 pKa = 7.46KK2 pKa = 10.21ALEE5 pKa = 4.47GFSRR9 pKa = 11.84ILITFIVAVMVIVKK23 pKa = 10.36ADD25 pKa = 3.05IRR27 pKa = 11.84RR28 pKa = 11.84DD29 pKa = 3.41CRR31 pKa = 11.84KK32 pKa = 9.84QSGVSWAALKK42 pKa = 10.48KK43 pKa = 10.45LRR45 pKa = 11.84AGDD48 pKa = 4.25FNQEE52 pKa = 3.82DD53 pKa = 4.34HH54 pKa = 7.4SVKK57 pKa = 10.54CYY59 pKa = 10.42LKK61 pKa = 10.86CFMVKK66 pKa = 10.25NGIMSEE72 pKa = 4.04DD73 pKa = 3.75NYY75 pKa = 10.86VDD77 pKa = 3.0VDD79 pKa = 3.25KK80 pKa = 11.18ALRR83 pKa = 11.84HH84 pKa = 5.9LPRR87 pKa = 11.84KK88 pKa = 9.07LQEE91 pKa = 3.79PSRR94 pKa = 11.84KK95 pKa = 9.05ILARR99 pKa = 11.84CKK101 pKa = 10.64DD102 pKa = 3.49SAGKK106 pKa = 10.06DD107 pKa = 3.4SCDD110 pKa = 3.79KK111 pKa = 10.87AFQIAKK117 pKa = 9.7CYY119 pKa = 9.93FKK121 pKa = 10.85SQPGILKK128 pKa = 10.08NVSFVV133 pKa = 3.12
Molecular weight: 15.12 kDa
Isoelectric point according different methods:
Peptides (in silico digests for buttom-up proteomics)
Below you can find in silico digests of the whole proteome with Trypsin, Chymotrypsin, Trypsin+LysC, LysN, ArgC proteases suitable for different mass spec machines.| Try ESI |
 |
|---|
| ChTry ESI |
 |
|---|
| ArgC ESI |
 |
|---|
| LysN ESI |
 |
|---|
| TryLysC ESI |
 |
|---|
| Try MALDI |
 |
|---|
| ChTry MALDI |
 |
|---|
| ArgC MALDI |
 |
|---|
| LysN MALDI |
 |
|---|
| TryLysC MALDI |
 |
|---|
| Try LTQ |
 |
|---|
| ChTry LTQ |
 |
|---|
| ArgC LTQ |
 |
|---|
| LysN LTQ |
 |
|---|
| TryLysC LTQ |
 |
|---|
| Try MSlow |
 |
|---|
| ChTry MSlow |
 |
|---|
| ArgC MSlow |
 |
|---|
| LysN MSlow |
 |
|---|
| TryLysC MSlow |
 |
|---|
| Try MShigh |
 |
|---|
| ChTry MShigh |
 |
|---|
| ArgC MShigh |
 |
|---|
| LysN MShigh |
 |
|---|
| TryLysC MShigh |
 |
|---|
General Statistics
Number of major isoforms |
Number of additional isoforms |
Number of all proteins |
Number of amino acids |
Min. Seq. Length |
Max. Seq. Length |
Avg. Seq. Length |
Avg. Mol. Weight |
|---|---|---|---|---|---|---|---|
0 |
71586 |
113 |
935 |
447.4 |
51.38 |
Amino acid frequency
Ala |
Cys |
Asp |
Glu |
Phe |
Gly |
His |
Ile |
Lys |
Leu |
|---|---|---|---|---|---|---|---|---|---|
5.184 ± 0.104 | 2.277 ± 0.074 |
4.012 ± 0.097 | 4.655 ± 0.085 |
6.125 ± 0.11 | 4.23 ± 0.083 |
2.026 ± 0.052 | 9.143 ± 0.169 |
5.29 ± 0.106 | 11.762 ± 0.121 |
Met |
Asn |
Gln |
Pro |
Arg |
Ser |
Thr |
Val |
Trp |
Tyr |
|---|---|---|---|---|---|---|---|---|---|
3.08 ± 0.076 | 5.153 ± 0.102 |
2.853 ± 0.079 | 3.01 ± 0.063 |
4.567 ± 0.089 | 7.489 ± 0.1 |
6.251 ± 0.085 | 6.859 ± 0.087 |
1.449 ± 0.042 | 4.586 ± 0.084 |
Most of the basic statistics you can see at this page can be downloaded from this CSV file
Proteome-pI is available under Creative Commons Attribution-NoDerivs license, for more details see here
| Reference: Kozlowski LP. Proteome-pI 2.0: Proteome Isoelectric Point Database Update. Nucleic Acids Res. 2021, doi: 10.1093/nar/gkab944 | Contact: Lukasz P. Kozlowski |
