Bacillus akibai (strain ATCC 43226 / DSM 21942 / JCM 9157 / 1139)
Taxonomy: cellular organisms; Bacteria; Terrabacteria group; Firmicutes; Bacilli; Bacillales; Bacillaceae; Alkalihalobacillus; Alkalihalobacillus akibai
Average proteome isoelectric point is 6.22
Get precalculated fractions of proteins

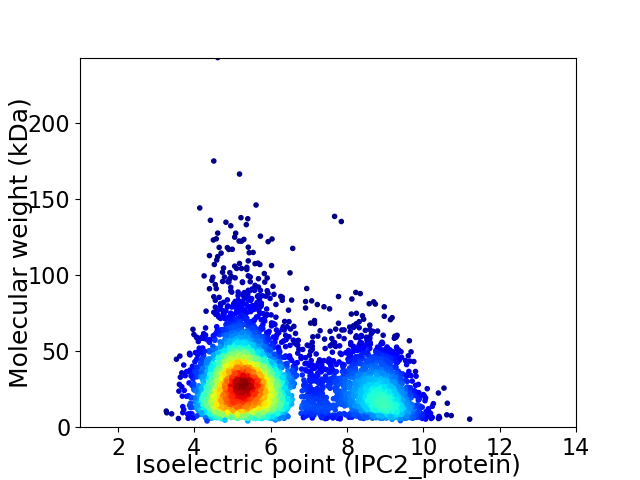
Virtual 2D-PAGE plot for 4710 proteins (isoelectric point calculated using IPC2_protein)
Get csv file with sequences according to given criteria:
* You can choose from 21 different methods for calculating isoelectric point
Summary statistics related to proteome-wise predictions


Protein with the lowest isoelectric point:
>tr|W4QPL1|W4QPL1_BACA3 Serine-type D-Ala-D-Ala carboxypeptidase OS=Bacillus akibai (strain ATCC 43226 / DSM 21942 / JCM 9157 / 1139) OX=1236973 GN=JCM9157_878 PE=3 SV=1
MM1 pKa = 7.44KK2 pKa = 10.19KK3 pKa = 10.35VSYY6 pKa = 11.29LMMLALALMLVLAACGGAADD26 pKa = 5.28PDD28 pKa = 4.18PAPADD33 pKa = 3.7DD34 pKa = 4.54AEE36 pKa = 4.52EE37 pKa = 4.19TGEE40 pKa = 4.02EE41 pKa = 4.33TEE43 pKa = 4.49AEE45 pKa = 4.18GGEE48 pKa = 4.0ATTRR52 pKa = 11.84EE53 pKa = 4.17FTDD56 pKa = 3.06ITVMTGGEE64 pKa = 3.91QGTYY68 pKa = 10.15FPLGAALANNIINVHH83 pKa = 5.08VEE85 pKa = 4.04NVDD88 pKa = 3.36AASFSSGASVANINSLVDD106 pKa = 3.57GDD108 pKa = 4.69ADD110 pKa = 4.06LALVQNDD117 pKa = 3.47VAFFASEE124 pKa = 4.52GINMFEE130 pKa = 4.08EE131 pKa = 4.7AGALEE136 pKa = 4.63GFQGIATLYY145 pKa = 9.98PEE147 pKa = 5.08VIQIITAADD156 pKa = 3.39SGIEE160 pKa = 4.1TVEE163 pKa = 4.0DD164 pKa = 3.66LVGKK168 pKa = 10.16RR169 pKa = 11.84VAVGDD174 pKa = 4.13LGSGAEE180 pKa = 3.9INARR184 pKa = 11.84QILEE188 pKa = 4.14VHH190 pKa = 6.22GLSYY194 pKa = 11.51DD195 pKa = 4.47DD196 pKa = 4.2ISEE199 pKa = 4.46EE200 pKa = 4.11YY201 pKa = 10.14MSFGDD206 pKa = 3.85AAGSIQDD213 pKa = 3.99GNIDD217 pKa = 3.62AAFITAGLPTGAVEE231 pKa = 4.08ALKK234 pKa = 9.43ATKK237 pKa = 9.91EE238 pKa = 3.73ISLVSISAEE247 pKa = 4.01KK248 pKa = 10.13IAEE251 pKa = 3.98LSAAYY256 pKa = 8.74PYY258 pKa = 9.08YY259 pKa = 10.84TEE261 pKa = 4.07FTVPADD267 pKa = 3.71AYY269 pKa = 9.24GTAGDD274 pKa = 3.89TTTAAVLAMLAVSADD289 pKa = 3.31MDD291 pKa = 3.96EE292 pKa = 4.71DD293 pKa = 3.81LVYY296 pKa = 10.79DD297 pKa = 3.3ITKK300 pKa = 11.02AMFEE304 pKa = 4.14NTDD307 pKa = 3.28AFSNAHH313 pKa = 4.55QQGNNITLEE322 pKa = 4.09SALDD326 pKa = 3.65GMSIPVHH333 pKa = 6.53PGAQRR338 pKa = 11.84YY339 pKa = 8.74YY340 pKa = 11.03DD341 pKa = 3.72EE342 pKa = 4.21QQ343 pKa = 5.07
MM1 pKa = 7.44KK2 pKa = 10.19KK3 pKa = 10.35VSYY6 pKa = 11.29LMMLALALMLVLAACGGAADD26 pKa = 5.28PDD28 pKa = 4.18PAPADD33 pKa = 3.7DD34 pKa = 4.54AEE36 pKa = 4.52EE37 pKa = 4.19TGEE40 pKa = 4.02EE41 pKa = 4.33TEE43 pKa = 4.49AEE45 pKa = 4.18GGEE48 pKa = 4.0ATTRR52 pKa = 11.84EE53 pKa = 4.17FTDD56 pKa = 3.06ITVMTGGEE64 pKa = 3.91QGTYY68 pKa = 10.15FPLGAALANNIINVHH83 pKa = 5.08VEE85 pKa = 4.04NVDD88 pKa = 3.36AASFSSGASVANINSLVDD106 pKa = 3.57GDD108 pKa = 4.69ADD110 pKa = 4.06LALVQNDD117 pKa = 3.47VAFFASEE124 pKa = 4.52GINMFEE130 pKa = 4.08EE131 pKa = 4.7AGALEE136 pKa = 4.63GFQGIATLYY145 pKa = 9.98PEE147 pKa = 5.08VIQIITAADD156 pKa = 3.39SGIEE160 pKa = 4.1TVEE163 pKa = 4.0DD164 pKa = 3.66LVGKK168 pKa = 10.16RR169 pKa = 11.84VAVGDD174 pKa = 4.13LGSGAEE180 pKa = 3.9INARR184 pKa = 11.84QILEE188 pKa = 4.14VHH190 pKa = 6.22GLSYY194 pKa = 11.51DD195 pKa = 4.47DD196 pKa = 4.2ISEE199 pKa = 4.46EE200 pKa = 4.11YY201 pKa = 10.14MSFGDD206 pKa = 3.85AAGSIQDD213 pKa = 3.99GNIDD217 pKa = 3.62AAFITAGLPTGAVEE231 pKa = 4.08ALKK234 pKa = 9.43ATKK237 pKa = 9.91EE238 pKa = 3.73ISLVSISAEE247 pKa = 4.01KK248 pKa = 10.13IAEE251 pKa = 3.98LSAAYY256 pKa = 8.74PYY258 pKa = 9.08YY259 pKa = 10.84TEE261 pKa = 4.07FTVPADD267 pKa = 3.71AYY269 pKa = 9.24GTAGDD274 pKa = 3.89TTTAAVLAMLAVSADD289 pKa = 3.31MDD291 pKa = 3.96EE292 pKa = 4.71DD293 pKa = 3.81LVYY296 pKa = 10.79DD297 pKa = 3.3ITKK300 pKa = 11.02AMFEE304 pKa = 4.14NTDD307 pKa = 3.28AFSNAHH313 pKa = 4.55QQGNNITLEE322 pKa = 4.09SALDD326 pKa = 3.65GMSIPVHH333 pKa = 6.53PGAQRR338 pKa = 11.84YY339 pKa = 8.74YY340 pKa = 11.03DD341 pKa = 3.72EE342 pKa = 4.21QQ343 pKa = 5.07
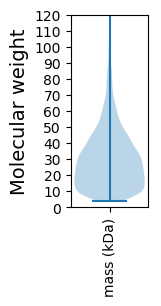
Molecular weight: 35.73 kDa
Isoelectric point according different methods:
Protein with the highest isoelectric point:
>tr|W4QT33|W4QT33_BACA3 Maltodextrin-binding protein OS=Bacillus akibai (strain ATCC 43226 / DSM 21942 / JCM 9157 / 1139) OX=1236973 GN=JCM9157_2361 PE=3 SV=1
MM1 pKa = 7.71GKK3 pKa = 8.0PTFQPNNRR11 pKa = 11.84KK12 pKa = 9.23RR13 pKa = 11.84KK14 pKa = 8.22KK15 pKa = 8.69VHH17 pKa = 5.46GFRR20 pKa = 11.84ARR22 pKa = 11.84MSTKK26 pKa = 10.19NGRR29 pKa = 11.84KK30 pKa = 8.49VLARR34 pKa = 11.84RR35 pKa = 11.84RR36 pKa = 11.84RR37 pKa = 11.84KK38 pKa = 9.05GRR40 pKa = 11.84KK41 pKa = 8.7VLSAA45 pKa = 4.05
MM1 pKa = 7.71GKK3 pKa = 8.0PTFQPNNRR11 pKa = 11.84KK12 pKa = 9.23RR13 pKa = 11.84KK14 pKa = 8.22KK15 pKa = 8.69VHH17 pKa = 5.46GFRR20 pKa = 11.84ARR22 pKa = 11.84MSTKK26 pKa = 10.19NGRR29 pKa = 11.84KK30 pKa = 8.49VLARR34 pKa = 11.84RR35 pKa = 11.84RR36 pKa = 11.84RR37 pKa = 11.84KK38 pKa = 9.05GRR40 pKa = 11.84KK41 pKa = 8.7VLSAA45 pKa = 4.05
Molecular weight: 5.31 kDa
Isoelectric point according different methods:
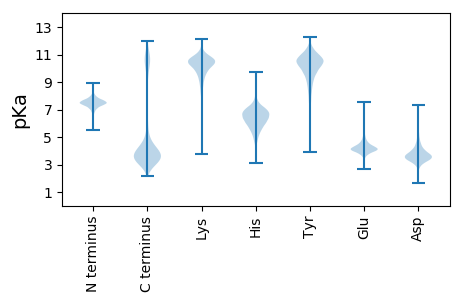
Peptides (in silico digests for buttom-up proteomics)
Below you can find in silico digests of the whole proteome with Trypsin, Chymotrypsin, Trypsin+LysC, LysN, ArgC proteases suitable for different mass spec machines.| Try ESI |
 |
|---|
| ChTry ESI |
 |
|---|
| ArgC ESI |
 |
|---|
| LysN ESI |
 |
|---|
| TryLysC ESI |
 |
|---|
| Try MALDI |
 |
|---|
| ChTry MALDI |
 |
|---|
| ArgC MALDI |
 |
|---|
| LysN MALDI |
 |
|---|
| TryLysC MALDI |
 |
|---|
| Try LTQ |
 |
|---|
| ChTry LTQ |
 |
|---|
| ArgC LTQ |
 |
|---|
| LysN LTQ |
 |
|---|
| TryLysC LTQ |
 |
|---|
| Try MSlow |
 |
|---|
| ChTry MSlow |
 |
|---|
| ArgC MSlow |
 |
|---|
| LysN MSlow |
 |
|---|
| TryLysC MSlow |
 |
|---|
| Try MShigh |
 |
|---|
| ChTry MShigh |
 |
|---|
| ArgC MShigh |
 |
|---|
| LysN MShigh |
 |
|---|
| TryLysC MShigh |
 |
|---|
General Statistics
Number of major isoforms |
Number of additional isoforms |
Number of all proteins |
Number of amino acids |
Min. Seq. Length |
Max. Seq. Length |
Avg. Seq. Length |
Avg. Mol. Weight |
|---|---|---|---|---|---|---|---|
0 |
1307598 |
37 |
2162 |
277.6 |
31.26 |
Amino acid frequency
Ala |
Cys |
Asp |
Glu |
Phe |
Gly |
His |
Ile |
Lys |
Leu |
|---|---|---|---|---|---|---|---|---|---|
6.742 ± 0.042 | 0.708 ± 0.012 |
5.019 ± 0.029 | 7.749 ± 0.039 |
4.629 ± 0.03 | 6.654 ± 0.037 |
2.145 ± 0.018 | 7.794 ± 0.035 |
6.531 ± 0.039 | 9.998 ± 0.044 |
Met |
Asn |
Gln |
Pro |
Arg |
Ser |
Thr |
Val |
Trp |
Tyr |
|---|---|---|---|---|---|---|---|---|---|
2.713 ± 0.015 | 4.438 ± 0.028 |
3.524 ± 0.022 | 4.008 ± 0.03 |
4.084 ± 0.028 | 5.996 ± 0.026 |
5.55 ± 0.024 | 7.184 ± 0.033 |
1.072 ± 0.014 | 3.462 ± 0.023 |
Most of the basic statistics you can see at this page can be downloaded from this CSV file
Proteome-pI is available under Creative Commons Attribution-NoDerivs license, for more details see here
| Reference: Kozlowski LP. Proteome-pI 2.0: Proteome Isoelectric Point Database Update. Nucleic Acids Res. 2021, doi: 10.1093/nar/gkab944 | Contact: Lukasz P. Kozlowski |
