Methylovirgula ligni
Taxonomy: cellular organisms; Bacteria; Proteobacteria; Alphaproteobacteria; Hyphomicrobiales; Beijerinckiaceae; Methylovirgula
Average proteome isoelectric point is 6.63
Get precalculated fractions of proteins

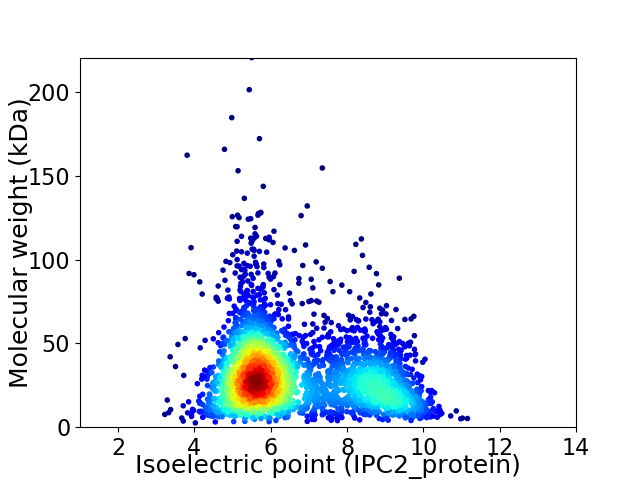
Virtual 2D-PAGE plot for 3170 proteins (isoelectric point calculated using IPC2_protein)
Get csv file with sequences according to given criteria:
* You can choose from 21 different methods for calculating isoelectric point
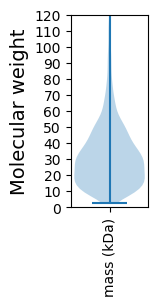
Summary statistics related to proteome-wise predictions


Protein with the lowest isoelectric point:
>tr|A0A3D9YUY7|A0A3D9YUY7_9RHIZ Uncharacterized protein OS=Methylovirgula ligni OX=569860 GN=DES32_2479 PE=4 SV=1
MM1 pKa = 7.37NLTTATHH8 pKa = 5.47VTQSALATVSAEE20 pKa = 3.94SALVSRR26 pKa = 11.84NIGGVNSPGFSEE38 pKa = 3.96KK39 pKa = 9.54TANVVTTADD48 pKa = 3.4GGVEE52 pKa = 4.17VASVTNAQSQAVFANVLSATAASATQSALSDD83 pKa = 3.69GLTTLATIVGEE94 pKa = 4.34PGSDD98 pKa = 2.94TSPAEE103 pKa = 4.08KK104 pKa = 10.64LSDD107 pKa = 3.63LTNALQQYY115 pKa = 7.24EE116 pKa = 4.42ASPSDD121 pKa = 3.42SSLASAAVTAGQNLASTLNNATATVQQVRR150 pKa = 11.84EE151 pKa = 4.15DD152 pKa = 4.24ADD154 pKa = 3.51SQMASSVSSINSLLTQFKK172 pKa = 10.56SVNQQIVTGTATGADD187 pKa = 3.69VTDD190 pKa = 4.95LLDD193 pKa = 3.62TRR195 pKa = 11.84NSILTQLSQQIGITTSAGANNDD217 pKa = 2.99MSIYY221 pKa = 8.91TDD223 pKa = 3.13SGVTLFQNGTASTVNFQPTQTYY245 pKa = 7.79TAGTTGNAVYY255 pKa = 10.27IDD257 pKa = 4.08GVPVTGSSATMPIQTGALAGLANLRR282 pKa = 11.84DD283 pKa = 4.23NVTVTYY289 pKa = 10.36QSQLDD294 pKa = 3.56QTANGLISAFAEE306 pKa = 4.05TDD308 pKa = 3.45PSNSGSSLAGLFTNGSSTALPTAAQVTGLAGSITVNAAVDD348 pKa = 3.99PSQGGTAALLSDD360 pKa = 5.22GINFNYY366 pKa = 7.85NTSNQASYY374 pKa = 8.62DD375 pKa = 3.88TQLQQYY381 pKa = 7.14LTKK384 pKa = 10.82LSAAQSFSSAGGIGTSNTLSGYY406 pKa = 10.2AAASVSWLDD415 pKa = 4.17AEE417 pKa = 4.36QQNVQSEE424 pKa = 4.52SAYY427 pKa = 10.69QSTLLSTSTTALSNSTGVNLDD448 pKa = 4.09DD449 pKa = 5.8EE450 pKa = 4.79MSQMLDD456 pKa = 3.4LEE458 pKa = 4.4NSYY461 pKa = 11.36SATAKK466 pKa = 10.81LLTTINNMFSDD477 pKa = 4.72LATAIDD483 pKa = 3.77QATAAA488 pKa = 4.49
MM1 pKa = 7.37NLTTATHH8 pKa = 5.47VTQSALATVSAEE20 pKa = 3.94SALVSRR26 pKa = 11.84NIGGVNSPGFSEE38 pKa = 3.96KK39 pKa = 9.54TANVVTTADD48 pKa = 3.4GGVEE52 pKa = 4.17VASVTNAQSQAVFANVLSATAASATQSALSDD83 pKa = 3.69GLTTLATIVGEE94 pKa = 4.34PGSDD98 pKa = 2.94TSPAEE103 pKa = 4.08KK104 pKa = 10.64LSDD107 pKa = 3.63LTNALQQYY115 pKa = 7.24EE116 pKa = 4.42ASPSDD121 pKa = 3.42SSLASAAVTAGQNLASTLNNATATVQQVRR150 pKa = 11.84EE151 pKa = 4.15DD152 pKa = 4.24ADD154 pKa = 3.51SQMASSVSSINSLLTQFKK172 pKa = 10.56SVNQQIVTGTATGADD187 pKa = 3.69VTDD190 pKa = 4.95LLDD193 pKa = 3.62TRR195 pKa = 11.84NSILTQLSQQIGITTSAGANNDD217 pKa = 2.99MSIYY221 pKa = 8.91TDD223 pKa = 3.13SGVTLFQNGTASTVNFQPTQTYY245 pKa = 7.79TAGTTGNAVYY255 pKa = 10.27IDD257 pKa = 4.08GVPVTGSSATMPIQTGALAGLANLRR282 pKa = 11.84DD283 pKa = 4.23NVTVTYY289 pKa = 10.36QSQLDD294 pKa = 3.56QTANGLISAFAEE306 pKa = 4.05TDD308 pKa = 3.45PSNSGSSLAGLFTNGSSTALPTAAQVTGLAGSITVNAAVDD348 pKa = 3.99PSQGGTAALLSDD360 pKa = 5.22GINFNYY366 pKa = 7.85NTSNQASYY374 pKa = 8.62DD375 pKa = 3.88TQLQQYY381 pKa = 7.14LTKK384 pKa = 10.82LSAAQSFSSAGGIGTSNTLSGYY406 pKa = 10.2AAASVSWLDD415 pKa = 4.17AEE417 pKa = 4.36QQNVQSEE424 pKa = 4.52SAYY427 pKa = 10.69QSTLLSTSTTALSNSTGVNLDD448 pKa = 4.09DD449 pKa = 5.8EE450 pKa = 4.79MSQMLDD456 pKa = 3.4LEE458 pKa = 4.4NSYY461 pKa = 11.36SATAKK466 pKa = 10.81LLTTINNMFSDD477 pKa = 4.72LATAIDD483 pKa = 3.77QATAAA488 pKa = 4.49
Molecular weight: 49.37 kDa
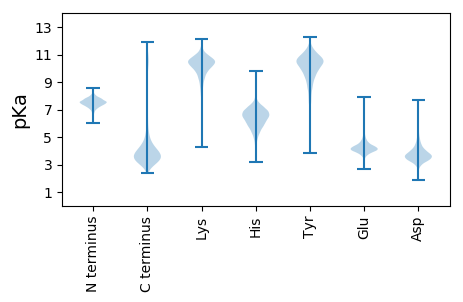
Isoelectric point according different methods:
Protein with the highest isoelectric point:
>tr|A0A3D9YYI5|A0A3D9YYI5_9RHIZ GNAT family acetyltransferase OS=Methylovirgula ligni OX=569860 GN=DES32_1057 PE=4 SV=1
MM1 pKa = 7.35KK2 pKa = 9.43RR3 pKa = 11.84TYY5 pKa = 10.27QPSKK9 pKa = 9.73LVRR12 pKa = 11.84KK13 pKa = 8.95RR14 pKa = 11.84RR15 pKa = 11.84HH16 pKa = 4.63GFRR19 pKa = 11.84SRR21 pKa = 11.84MATVGGRR28 pKa = 11.84KK29 pKa = 9.36VIATRR34 pKa = 11.84RR35 pKa = 11.84ARR37 pKa = 11.84GRR39 pKa = 11.84KK40 pKa = 9.01RR41 pKa = 11.84LSAA44 pKa = 4.03
MM1 pKa = 7.35KK2 pKa = 9.43RR3 pKa = 11.84TYY5 pKa = 10.27QPSKK9 pKa = 9.73LVRR12 pKa = 11.84KK13 pKa = 8.95RR14 pKa = 11.84RR15 pKa = 11.84HH16 pKa = 4.63GFRR19 pKa = 11.84SRR21 pKa = 11.84MATVGGRR28 pKa = 11.84KK29 pKa = 9.36VIATRR34 pKa = 11.84RR35 pKa = 11.84ARR37 pKa = 11.84GRR39 pKa = 11.84KK40 pKa = 9.01RR41 pKa = 11.84LSAA44 pKa = 4.03
Molecular weight: 5.18 kDa
Isoelectric point according different methods:
Peptides (in silico digests for buttom-up proteomics)
Below you can find in silico digests of the whole proteome with Trypsin, Chymotrypsin, Trypsin+LysC, LysN, ArgC proteases suitable for different mass spec machines.| Try ESI |
 |
|---|
| ChTry ESI |
 |
|---|
| ArgC ESI |
 |
|---|
| LysN ESI |
 |
|---|
| TryLysC ESI |
 |
|---|
| Try MALDI |
 |
|---|
| ChTry MALDI |
 |
|---|
| ArgC MALDI |
 |
|---|
| LysN MALDI |
 |
|---|
| TryLysC MALDI |
 |
|---|
| Try LTQ |
 |
|---|
| ChTry LTQ |
 |
|---|
| ArgC LTQ |
 |
|---|
| LysN LTQ |
 |
|---|
| TryLysC LTQ |
 |
|---|
| Try MSlow |
 |
|---|
| ChTry MSlow |
 |
|---|
| ArgC MSlow |
 |
|---|
| LysN MSlow |
 |
|---|
| TryLysC MSlow |
 |
|---|
| Try MShigh |
 |
|---|
| ChTry MShigh |
 |
|---|
| ArgC MShigh |
 |
|---|
| LysN MShigh |
 |
|---|
| TryLysC MShigh |
 |
|---|
General Statistics
Number of major isoforms |
Number of additional isoforms |
Number of all proteins |
Number of amino acids |
Min. Seq. Length |
Max. Seq. Length |
Avg. Seq. Length |
Avg. Mol. Weight |
|---|---|---|---|---|---|---|---|
0 |
974626 |
26 |
1985 |
307.5 |
33.31 |
Amino acid frequency
Ala |
Cys |
Asp |
Glu |
Phe |
Gly |
His |
Ile |
Lys |
Leu |
|---|---|---|---|---|---|---|---|---|---|
13.216 ± 0.072 | 0.807 ± 0.013 |
5.563 ± 0.034 | 5.491 ± 0.04 |
3.935 ± 0.026 | 8.169 ± 0.041 |
2.175 ± 0.021 | 5.45 ± 0.031 |
3.536 ± 0.035 | 10.384 ± 0.047 |
Met |
Asn |
Gln |
Pro |
Arg |
Ser |
Thr |
Val |
Trp |
Tyr |
|---|---|---|---|---|---|---|---|---|---|
1.945 ± 0.019 | 2.657 ± 0.028 |
5.374 ± 0.038 | 3.129 ± 0.029 |
6.844 ± 0.043 | 5.374 ± 0.033 |
5.236 ± 0.034 | 7.135 ± 0.038 |
1.239 ± 0.018 | 2.341 ± 0.026 |
Most of the basic statistics you can see at this page can be downloaded from this CSV file
Proteome-pI is available under Creative Commons Attribution-NoDerivs license, for more details see here
| Reference: Kozlowski LP. Proteome-pI 2.0: Proteome Isoelectric Point Database Update. Nucleic Acids Res. 2021, doi: 10.1093/nar/gkab944 | Contact: Lukasz P. Kozlowski |
