Mycobacterium phage Xavia
Taxonomy: Viruses; Duplodnaviria; Heunggongvirae; Uroviricota; Caudoviricetes; Caudovirales; Siphoviridae; unclassified Siphoviridae
Average proteome isoelectric point is 6.04
Get precalculated fractions of proteins
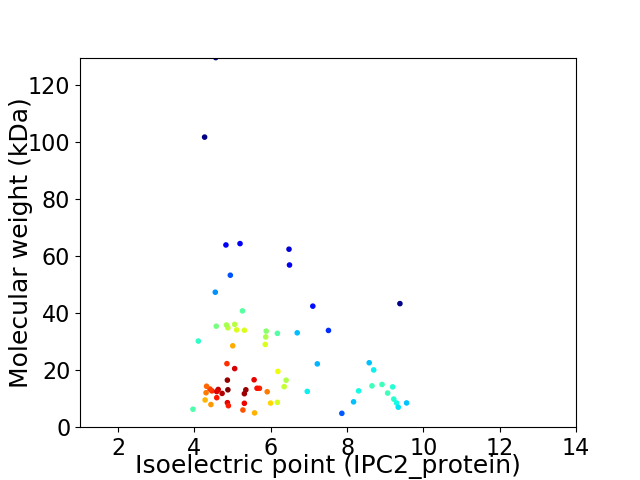
Virtual 2D-PAGE plot for 71 proteins (isoelectric point calculated using IPC2_protein)
Get csv file with sequences according to given criteria:
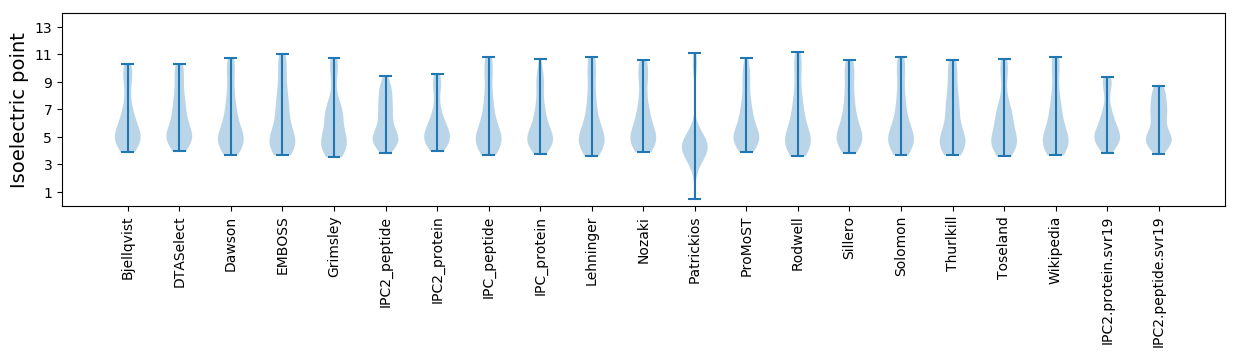
* You can choose from 21 different methods for calculating isoelectric point
Summary statistics related to proteome-wise predictions
Protein with the lowest isoelectric point:
>tr|A0A2U8UHZ7|A0A2U8UHZ7_9CAUD Uncharacterized protein OS=Mycobacterium phage Xavia OX=2178923 GN=33 PE=4 SV=1
MM1 pKa = 7.97RR2 pKa = 11.84YY3 pKa = 9.54GVAFQTAYY11 pKa = 11.12SDD13 pKa = 3.6FGGTTEE19 pKa = 4.1VIEE22 pKa = 4.64FEE24 pKa = 4.43SEE26 pKa = 3.59QAAQAFIDD34 pKa = 3.92AVQPGVGVVLSLVRR48 pKa = 11.84FDD50 pKa = 4.05YY51 pKa = 10.56STFEE55 pKa = 4.37TIGG58 pKa = 3.19
MM1 pKa = 7.97RR2 pKa = 11.84YY3 pKa = 9.54GVAFQTAYY11 pKa = 11.12SDD13 pKa = 3.6FGGTTEE19 pKa = 4.1VIEE22 pKa = 4.64FEE24 pKa = 4.43SEE26 pKa = 3.59QAAQAFIDD34 pKa = 3.92AVQPGVGVVLSLVRR48 pKa = 11.84FDD50 pKa = 4.05YY51 pKa = 10.56STFEE55 pKa = 4.37TIGG58 pKa = 3.19
Molecular weight: 6.32 kDa
Isoelectric point according different methods:
Protein with the highest isoelectric point:
>tr|A0A2U8UHJ1|A0A2U8UHJ1_9CAUD Uncharacterized protein OS=Mycobacterium phage Xavia OX=2178923 GN=63 PE=4 SV=1
MM1 pKa = 7.6KK2 pKa = 10.31LFKK5 pKa = 10.34RR6 pKa = 11.84QPTAIEE12 pKa = 3.81LHH14 pKa = 6.15HH15 pKa = 6.57RR16 pKa = 11.84AILEE20 pKa = 3.78WRR22 pKa = 11.84RR23 pKa = 11.84NPTISTYY30 pKa = 11.23VMVDD34 pKa = 2.71GRR36 pKa = 11.84EE37 pKa = 3.9VRR39 pKa = 11.84RR40 pKa = 11.84RR41 pKa = 11.84AVDD44 pKa = 3.21PLTRR48 pKa = 11.84LGSLLDD54 pKa = 3.64RR55 pKa = 11.84VMDD58 pKa = 5.12TIADD62 pKa = 3.74VCGIPAPRR70 pKa = 11.84LGTVPGAPWLIADD83 pKa = 4.17EE84 pKa = 4.91GGARR88 pKa = 3.72
MM1 pKa = 7.6KK2 pKa = 10.31LFKK5 pKa = 10.34RR6 pKa = 11.84QPTAIEE12 pKa = 3.81LHH14 pKa = 6.15HH15 pKa = 6.57RR16 pKa = 11.84AILEE20 pKa = 3.78WRR22 pKa = 11.84RR23 pKa = 11.84NPTISTYY30 pKa = 11.23VMVDD34 pKa = 2.71GRR36 pKa = 11.84EE37 pKa = 3.9VRR39 pKa = 11.84RR40 pKa = 11.84RR41 pKa = 11.84AVDD44 pKa = 3.21PLTRR48 pKa = 11.84LGSLLDD54 pKa = 3.64RR55 pKa = 11.84VMDD58 pKa = 5.12TIADD62 pKa = 3.74VCGIPAPRR70 pKa = 11.84LGTVPGAPWLIADD83 pKa = 4.17EE84 pKa = 4.91GGARR88 pKa = 3.72
Molecular weight: 9.87 kDa
Isoelectric point according different methods:
Peptides (in silico digests for buttom-up proteomics)
Below you can find in silico digests of the whole proteome with Trypsin, Chymotrypsin, Trypsin+LysC, LysN, ArgC proteases suitable for different mass spec machines.| Try ESI |
 |
|---|
| ChTry ESI |
|
|---|
| ArgC ESI |
|
|---|
| LysN ESI |
|
|---|
| TryLysC ESI |
|
|---|
| Try MALDI |
|
|---|
| ChTry MALDI |
|
|---|
| ArgC MALDI |
|
|---|
| LysN MALDI |
|
|---|
| TryLysC MALDI |
|
|---|
| Try LTQ |
|
|---|
| ChTry LTQ |
|
|---|
| ArgC LTQ |
|
|---|
| LysN LTQ |
|
|---|
| TryLysC LTQ |
|
|---|
| Try MSlow |
|
|---|
| ChTry MSlow |
|
|---|
| ArgC MSlow |
|
|---|
| LysN MSlow |
|
|---|
| TryLysC MSlow |
|
|---|
| Try MShigh |
|
|---|
| ChTry MShigh |
|
|---|
| ArgC MShigh |
|
|---|
| LysN MShigh |
|
|---|
| TryLysC MShigh |
|
|---|
General Statistics
Number of major isoforms |
Number of additional isoforms |
Number of all proteins |
Number of amino acids |
Min. Seq. Length |
Max. Seq. Length |
Avg. Seq. Length |
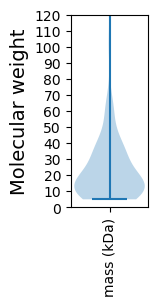
Avg. Mol. Weight |
|---|---|---|---|---|---|---|---|
0 |
16010 |
44 |
1256 |
225.5 |
24.59 |
Amino acid frequency
Ala |
Cys |
Asp |
Glu |
Phe |
Gly |
His |
Ile |
Lys |
Leu |
|---|---|---|---|---|---|---|---|---|---|
11.599 ± 0.44 | 1.031 ± 0.139 |
6.658 ± 0.178 | 6.246 ± 0.321 |
2.979 ± 0.16 | 8.745 ± 0.498 |
2.13 ± 0.164 | 4.241 ± 0.154 |
3.129 ± 0.178 | 8.089 ± 0.23 |
Met |
Asn |
Gln |
Pro |
Arg |
Ser |
Thr |
Val |
Trp |
Tyr |
|---|---|---|---|---|---|---|---|---|---|
1.936 ± 0.109 | 2.967 ± 0.206 |
6.046 ± 0.18 | 3.641 ± 0.218 |
7.258 ± 0.397 | 5.422 ± 0.228 |
6.309 ± 0.31 | 7.146 ± 0.31 |
2.024 ± 0.127 | 2.405 ± 0.119 |
Most of the basic statistics you can see at this page can be downloaded from this CSV file
See this proteome in:

Proteome-pI is available under Creative Commons Attribution-NoDerivs license, for more details see here
| Reference: Kozlowski LP. Proteome-pI 2.0: Proteome Isoelectric Point Database Update. Nucleic Acids Res. 2021, doi: 10.1093/nar/gkab944 | Contact: Lukasz P. Kozlowski |