Photobacterium lipolyticum
Taxonomy: cellular organisms; Bacteria; Proteobacteria; Gammaproteobacteria; Vibrionales; Vibrionaceae; Photobacterium
Average proteome isoelectric point is 6.09
Get precalculated fractions of proteins

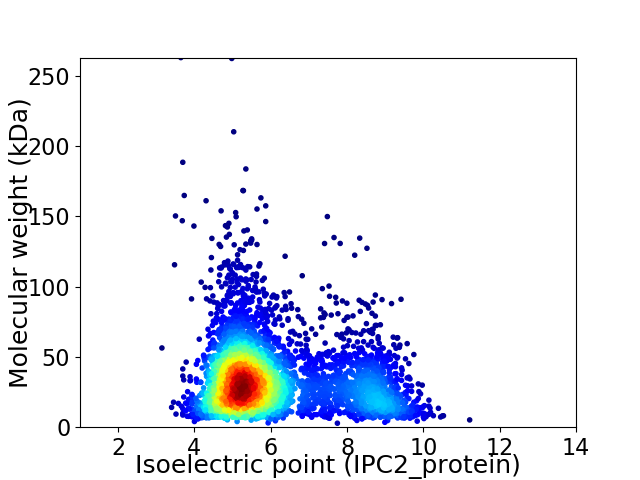
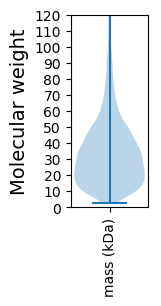
Virtual 2D-PAGE plot for 4228 proteins (isoelectric point calculated using IPC2_protein)
Get csv file with sequences according to given criteria:
* You can choose from 21 different methods for calculating isoelectric point
Summary statistics related to proteome-wise predictions


Protein with the lowest isoelectric point:
>tr|A0A2T3N529|A0A2T3N529_9GAMM Cytochrome c biogenesis ATP-binding export protein CcmA OS=Photobacterium lipolyticum OX=266810 GN=ccmA PE=3 SV=1
MM1 pKa = 7.65KK2 pKa = 9.08KK3 pKa = 8.28TLLALAVPALLAAGSATAGVNLYY26 pKa = 10.53DD27 pKa = 4.29ADD29 pKa = 4.13GVKK32 pKa = 9.93TDD34 pKa = 3.97LSGAAEE40 pKa = 3.9VQYY43 pKa = 10.54FQGYY47 pKa = 8.56EE48 pKa = 4.0EE49 pKa = 4.87NSDD52 pKa = 3.13AKK54 pKa = 10.65IRR56 pKa = 11.84LDD58 pKa = 4.96DD59 pKa = 4.56GDD61 pKa = 4.38LAVNTTVAVSGSLNAVAGLAFEE83 pKa = 4.59MEE85 pKa = 4.64SGDD88 pKa = 3.74VTNDD92 pKa = 3.46EE93 pKa = 4.59LWVGLAGDD101 pKa = 4.99FGTLTIGRR109 pKa = 11.84QYY111 pKa = 11.18LIADD115 pKa = 3.79DD116 pKa = 4.15SGIGKK121 pKa = 10.02DD122 pKa = 3.81YY123 pKa = 11.24EE124 pKa = 4.36LGGDD128 pKa = 3.52GLDD131 pKa = 3.33FVVANGDD138 pKa = 3.33QTIKK142 pKa = 11.04YY143 pKa = 9.97LFDD146 pKa = 3.83NGQFYY151 pKa = 11.05AGASALLKK159 pKa = 9.38EE160 pKa = 4.39TGKK163 pKa = 10.83AEE165 pKa = 4.71DD166 pKa = 3.78EE167 pKa = 4.41TTVFDD172 pKa = 3.91GRR174 pKa = 11.84LGARR178 pKa = 11.84FGDD181 pKa = 3.76LDD183 pKa = 3.69ARR185 pKa = 11.84VYY187 pKa = 10.5LYY189 pKa = 10.92SSSDD193 pKa = 3.19VDD195 pKa = 3.48GGDD198 pKa = 2.86IFGSVLDD205 pKa = 4.33GVAIDD210 pKa = 3.8VEE212 pKa = 4.79GFNLEE217 pKa = 4.02AEE219 pKa = 4.46YY220 pKa = 10.14IYY222 pKa = 11.19NAFAFAASFGQVEE235 pKa = 4.75YY236 pKa = 11.32KK237 pKa = 10.62NAANSADD244 pKa = 3.7KK245 pKa = 11.32VDD247 pKa = 3.74VDD249 pKa = 4.08TAALAGSYY257 pKa = 10.21TMDD260 pKa = 2.98RR261 pKa = 11.84TTFAVGYY268 pKa = 8.18TYY270 pKa = 11.38LDD272 pKa = 4.12FEE274 pKa = 7.01ADD276 pKa = 3.77DD277 pKa = 3.86VSAFYY282 pKa = 11.46ANVTQQLHH290 pKa = 6.38SNVKK294 pKa = 8.9VYY296 pKa = 11.26GEE298 pKa = 4.53IGSSDD303 pKa = 3.42ADD305 pKa = 3.3NSEE308 pKa = 4.16FGYY311 pKa = 9.59VAGMEE316 pKa = 4.3VSFF319 pKa = 5.08
MM1 pKa = 7.65KK2 pKa = 9.08KK3 pKa = 8.28TLLALAVPALLAAGSATAGVNLYY26 pKa = 10.53DD27 pKa = 4.29ADD29 pKa = 4.13GVKK32 pKa = 9.93TDD34 pKa = 3.97LSGAAEE40 pKa = 3.9VQYY43 pKa = 10.54FQGYY47 pKa = 8.56EE48 pKa = 4.0EE49 pKa = 4.87NSDD52 pKa = 3.13AKK54 pKa = 10.65IRR56 pKa = 11.84LDD58 pKa = 4.96DD59 pKa = 4.56GDD61 pKa = 4.38LAVNTTVAVSGSLNAVAGLAFEE83 pKa = 4.59MEE85 pKa = 4.64SGDD88 pKa = 3.74VTNDD92 pKa = 3.46EE93 pKa = 4.59LWVGLAGDD101 pKa = 4.99FGTLTIGRR109 pKa = 11.84QYY111 pKa = 11.18LIADD115 pKa = 3.79DD116 pKa = 4.15SGIGKK121 pKa = 10.02DD122 pKa = 3.81YY123 pKa = 11.24EE124 pKa = 4.36LGGDD128 pKa = 3.52GLDD131 pKa = 3.33FVVANGDD138 pKa = 3.33QTIKK142 pKa = 11.04YY143 pKa = 9.97LFDD146 pKa = 3.83NGQFYY151 pKa = 11.05AGASALLKK159 pKa = 9.38EE160 pKa = 4.39TGKK163 pKa = 10.83AEE165 pKa = 4.71DD166 pKa = 3.78EE167 pKa = 4.41TTVFDD172 pKa = 3.91GRR174 pKa = 11.84LGARR178 pKa = 11.84FGDD181 pKa = 3.76LDD183 pKa = 3.69ARR185 pKa = 11.84VYY187 pKa = 10.5LYY189 pKa = 10.92SSSDD193 pKa = 3.19VDD195 pKa = 3.48GGDD198 pKa = 2.86IFGSVLDD205 pKa = 4.33GVAIDD210 pKa = 3.8VEE212 pKa = 4.79GFNLEE217 pKa = 4.02AEE219 pKa = 4.46YY220 pKa = 10.14IYY222 pKa = 11.19NAFAFAASFGQVEE235 pKa = 4.75YY236 pKa = 11.32KK237 pKa = 10.62NAANSADD244 pKa = 3.7KK245 pKa = 11.32VDD247 pKa = 3.74VDD249 pKa = 4.08TAALAGSYY257 pKa = 10.21TMDD260 pKa = 2.98RR261 pKa = 11.84TTFAVGYY268 pKa = 8.18TYY270 pKa = 11.38LDD272 pKa = 4.12FEE274 pKa = 7.01ADD276 pKa = 3.77DD277 pKa = 3.86VSAFYY282 pKa = 11.46ANVTQQLHH290 pKa = 6.38SNVKK294 pKa = 8.9VYY296 pKa = 11.26GEE298 pKa = 4.53IGSSDD303 pKa = 3.42ADD305 pKa = 3.3NSEE308 pKa = 4.16FGYY311 pKa = 9.59VAGMEE316 pKa = 4.3VSFF319 pKa = 5.08
Molecular weight: 33.65 kDa
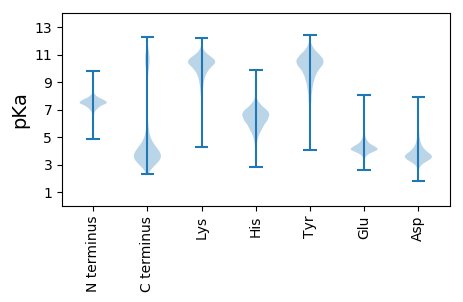
Isoelectric point according different methods:
Protein with the highest isoelectric point:
>tr|A0A2T3MSZ1|A0A2T3MSZ1_9GAMM ATP-dependent protease OS=Photobacterium lipolyticum OX=266810 GN=C9I89_20030 PE=3 SV=1
MM1 pKa = 7.45KK2 pKa = 9.51RR3 pKa = 11.84TFQPSVLKK11 pKa = 10.46RR12 pKa = 11.84KK13 pKa = 9.37RR14 pKa = 11.84NHH16 pKa = 5.37GFRR19 pKa = 11.84ARR21 pKa = 11.84MATKK25 pKa = 10.44NGRR28 pKa = 11.84ATINARR34 pKa = 11.84RR35 pKa = 11.84AKK37 pKa = 9.74GRR39 pKa = 11.84KK40 pKa = 8.91RR41 pKa = 11.84LSKK44 pKa = 10.84
MM1 pKa = 7.45KK2 pKa = 9.51RR3 pKa = 11.84TFQPSVLKK11 pKa = 10.46RR12 pKa = 11.84KK13 pKa = 9.37RR14 pKa = 11.84NHH16 pKa = 5.37GFRR19 pKa = 11.84ARR21 pKa = 11.84MATKK25 pKa = 10.44NGRR28 pKa = 11.84ATINARR34 pKa = 11.84RR35 pKa = 11.84AKK37 pKa = 9.74GRR39 pKa = 11.84KK40 pKa = 8.91RR41 pKa = 11.84LSKK44 pKa = 10.84
Molecular weight: 5.18 kDa
Isoelectric point according different methods:
Peptides (in silico digests for buttom-up proteomics)
Below you can find in silico digests of the whole proteome with Trypsin, Chymotrypsin, Trypsin+LysC, LysN, ArgC proteases suitable for different mass spec machines.| Try ESI |
 |
|---|
| ChTry ESI |
 |
|---|
| ArgC ESI |
 |
|---|
| LysN ESI |
 |
|---|
| TryLysC ESI |
 |
|---|
| Try MALDI |
 |
|---|
| ChTry MALDI |
 |
|---|
| ArgC MALDI |
 |
|---|
| LysN MALDI |
 |
|---|
| TryLysC MALDI |
 |
|---|
| Try LTQ |
 |
|---|
| ChTry LTQ |
 |
|---|
| ArgC LTQ |
 |
|---|
| LysN LTQ |
 |
|---|
| TryLysC LTQ |
 |
|---|
| Try MSlow |
 |
|---|
| ChTry MSlow |
 |
|---|
| ArgC MSlow |
 |
|---|
| LysN MSlow |
 |
|---|
| TryLysC MSlow |
 |
|---|
| Try MShigh |
 |
|---|
| ChTry MShigh |
 |
|---|
| ArgC MShigh |
 |
|---|
| LysN MShigh |
 |
|---|
| TryLysC MShigh |
 |
|---|
General Statistics
Number of major isoforms |
Number of additional isoforms |
Number of all proteins |
Number of amino acids |
Min. Seq. Length |
Max. Seq. Length |
Avg. Seq. Length |
Avg. Mol. Weight |
|---|---|---|---|---|---|---|---|
0 |
1369385 |
26 |
2525 |
323.9 |
35.95 |
Amino acid frequency
Ala |
Cys |
Asp |
Glu |
Phe |
Gly |
His |
Ile |
Lys |
Leu |
|---|---|---|---|---|---|---|---|---|---|
8.862 ± 0.042 | 1.123 ± 0.013 |
5.591 ± 0.035 | 6.251 ± 0.038 |
3.98 ± 0.028 | 6.911 ± 0.037 |
2.252 ± 0.018 | 6.407 ± 0.029 |
5.137 ± 0.032 | 10.442 ± 0.053 |
Met |
Asn |
Gln |
Pro |
Arg |
Ser |
Thr |
Val |
Trp |
Tyr |
|---|---|---|---|---|---|---|---|---|---|
2.711 ± 0.021 | 4.149 ± 0.028 |
3.996 ± 0.021 | 4.585 ± 0.034 |
4.742 ± 0.031 | 6.349 ± 0.033 |
5.375 ± 0.023 | 6.941 ± 0.037 |
1.227 ± 0.016 | 2.97 ± 0.022 |
Most of the basic statistics you can see at this page can be downloaded from this CSV file
Proteome-pI is available under Creative Commons Attribution-NoDerivs license, for more details see here
| Reference: Kozlowski LP. Proteome-pI 2.0: Proteome Isoelectric Point Database Update. Nucleic Acids Res. 2021, doi: 10.1093/nar/gkab944 | Contact: Lukasz P. Kozlowski |
