Bacillus sp. CHD6a
Taxonomy: cellular organisms; Bacteria; Terrabacteria group; Firmicutes; Bacilli; Bacillales; Bacillaceae; Bacillus; unclassified Bacillus (in: Bacteria)
Average proteome isoelectric point is 6.22
Get precalculated fractions of proteins
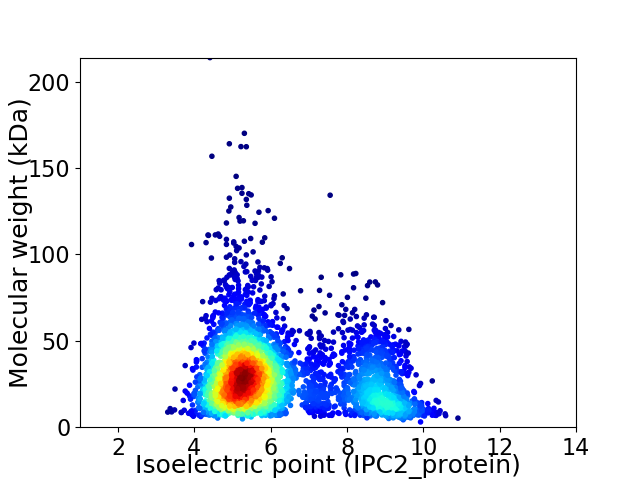
Virtual 2D-PAGE plot for 3740 proteins (isoelectric point calculated using IPC2_protein)
Get csv file with sequences according to given criteria:
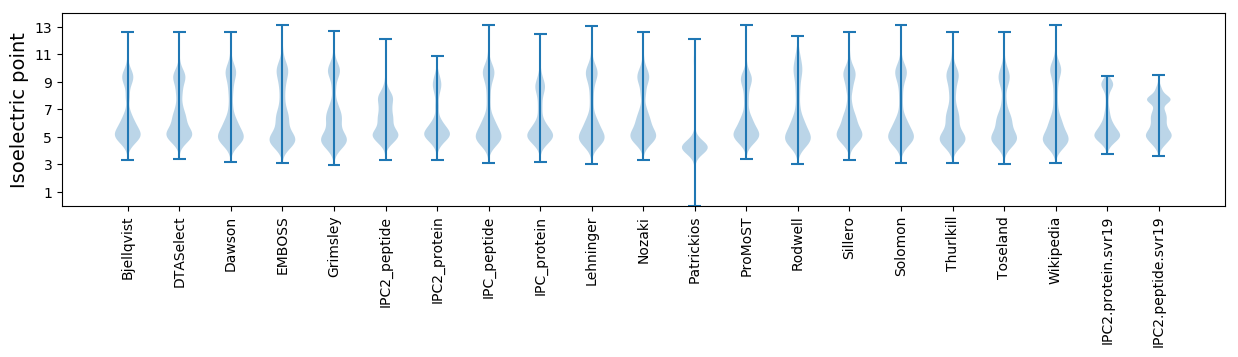
* You can choose from 21 different methods for calculating isoelectric point
Summary statistics related to proteome-wise predictions
Protein with the lowest isoelectric point:
>tr|A0A0M9GV97|A0A0M9GV97_9BACI 5'-3' exonuclease OS=Bacillus sp. CHD6a OX=1643452 GN=AAV98_02130 PE=4 SV=1
MM1 pKa = 6.2YY2 pKa = 9.31TIYY5 pKa = 11.13NKK7 pKa = 11.12GEE9 pKa = 4.18LDD11 pKa = 3.65GLASPTYY18 pKa = 8.22WWPEE22 pKa = 3.65DD23 pKa = 3.98RR24 pKa = 11.84SWCVSTDD31 pKa = 2.98YY32 pKa = 11.58DD33 pKa = 4.85LDD35 pKa = 3.72FTIFGGNKK43 pKa = 8.88QLFDD47 pKa = 3.91ALMFNDD53 pKa = 3.79KK54 pKa = 10.83LEE56 pKa = 4.76CIEE59 pKa = 4.26VDD61 pKa = 3.28LEE63 pKa = 4.28TRR65 pKa = 11.84IDD67 pKa = 3.62EE68 pKa = 4.35
MM1 pKa = 6.2YY2 pKa = 9.31TIYY5 pKa = 11.13NKK7 pKa = 11.12GEE9 pKa = 4.18LDD11 pKa = 3.65GLASPTYY18 pKa = 8.22WWPEE22 pKa = 3.65DD23 pKa = 3.98RR24 pKa = 11.84SWCVSTDD31 pKa = 2.98YY32 pKa = 11.58DD33 pKa = 4.85LDD35 pKa = 3.72FTIFGGNKK43 pKa = 8.88QLFDD47 pKa = 3.91ALMFNDD53 pKa = 3.79KK54 pKa = 10.83LEE56 pKa = 4.76CIEE59 pKa = 4.26VDD61 pKa = 3.28LEE63 pKa = 4.28TRR65 pKa = 11.84IDD67 pKa = 3.62EE68 pKa = 4.35
Molecular weight: 8.04 kDa
Isoelectric point according different methods:
Protein with the highest isoelectric point:
>tr|A0A0M9GT15|A0A0M9GT15_9BACI Uncharacterized protein OS=Bacillus sp. CHD6a OX=1643452 GN=AAV98_08550 PE=4 SV=1
MM1 pKa = 7.44KK2 pKa = 9.6RR3 pKa = 11.84TFQPNNRR10 pKa = 11.84KK11 pKa = 9.27RR12 pKa = 11.84SKK14 pKa = 9.25VHH16 pKa = 5.86GFRR19 pKa = 11.84EE20 pKa = 4.33RR21 pKa = 11.84MSSANGRR28 pKa = 11.84KK29 pKa = 8.82VLARR33 pKa = 11.84RR34 pKa = 11.84RR35 pKa = 11.84RR36 pKa = 11.84KK37 pKa = 9.05GRR39 pKa = 11.84KK40 pKa = 8.7VLSAA44 pKa = 4.05
MM1 pKa = 7.44KK2 pKa = 9.6RR3 pKa = 11.84TFQPNNRR10 pKa = 11.84KK11 pKa = 9.27RR12 pKa = 11.84SKK14 pKa = 9.25VHH16 pKa = 5.86GFRR19 pKa = 11.84EE20 pKa = 4.33RR21 pKa = 11.84MSSANGRR28 pKa = 11.84KK29 pKa = 8.82VLARR33 pKa = 11.84RR34 pKa = 11.84RR35 pKa = 11.84RR36 pKa = 11.84KK37 pKa = 9.05GRR39 pKa = 11.84KK40 pKa = 8.7VLSAA44 pKa = 4.05
Molecular weight: 5.25 kDa
Isoelectric point according different methods:
Peptides (in silico digests for buttom-up proteomics)
Below you can find in silico digests of the whole proteome with Trypsin, Chymotrypsin, Trypsin+LysC, LysN, ArgC proteases suitable for different mass spec machines.| Try ESI |
 |
|---|
| ChTry ESI |
|
|---|
| ArgC ESI |
|
|---|
| LysN ESI |
|
|---|
| TryLysC ESI |
|
|---|
| Try MALDI |
|
|---|
| ChTry MALDI |
|
|---|
| ArgC MALDI |
|
|---|
| LysN MALDI |
|
|---|
| TryLysC MALDI |
|
|---|
| Try LTQ |
|
|---|
| ChTry LTQ |
|
|---|
| ArgC LTQ |
|
|---|
| LysN LTQ |
|
|---|
| TryLysC LTQ |
|
|---|
| Try MSlow |
|
|---|
| ChTry MSlow |
|
|---|
| ArgC MSlow |
|
|---|
| LysN MSlow |
|
|---|
| TryLysC MSlow |
|
|---|
| Try MShigh |
|
|---|
| ChTry MShigh |
|
|---|
| ArgC MShigh |
|
|---|
| LysN MShigh |
|
|---|
| TryLysC MShigh |
|
|---|
General Statistics
Number of major isoforms |
Number of additional isoforms |
Number of all proteins |
Number of amino acids |
Min. Seq. Length |
Max. Seq. Length |
Avg. Seq. Length |
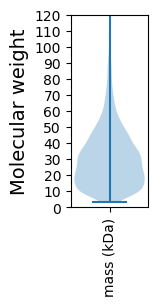
Avg. Mol. Weight |
|---|---|---|---|---|---|---|---|
0 |
1060701 |
26 |
1921 |
283.6 |
31.9 |
Amino acid frequency
Ala |
Cys |
Asp |
Glu |
Phe |
Gly |
His |
Ile |
Lys |
Leu |
|---|---|---|---|---|---|---|---|---|---|
6.755 ± 0.048 | 0.697 ± 0.011 |
5.03 ± 0.031 | 7.909 ± 0.052 |
4.613 ± 0.037 | 6.836 ± 0.042 |
2.129 ± 0.021 | 7.519 ± 0.041 |
6.914 ± 0.041 | 9.865 ± 0.05 |
Met |
Asn |
Gln |
Pro |
Arg |
Ser |
Thr |
Val |
Trp |
Tyr |
|---|---|---|---|---|---|---|---|---|---|
2.888 ± 0.017 | 4.285 ± 0.027 |
3.572 ± 0.025 | 3.651 ± 0.025 |
4.002 ± 0.029 | 5.984 ± 0.031 |
5.474 ± 0.023 | 7.31 ± 0.035 |
1.036 ± 0.016 | 3.532 ± 0.03 |
Most of the basic statistics you can see at this page can be downloaded from this CSV file
See this proteome in:

Proteome-pI is available under Creative Commons Attribution-NoDerivs license, for more details see here
| Reference: Kozlowski LP. Proteome-pI 2.0: Proteome Isoelectric Point Database Update. Nucleic Acids Res. 2021, doi: 10.1093/nar/gkab944 | Contact: Lukasz P. Kozlowski |