Paraburkholderia lycopersici
Taxonomy: cellular organisms; Bacteria; Proteobacteria; Betaproteobacteria; Burkholderiales; Burkholderiaceae; Paraburkholderia
Average proteome isoelectric point is 6.78
Get precalculated fractions of proteins

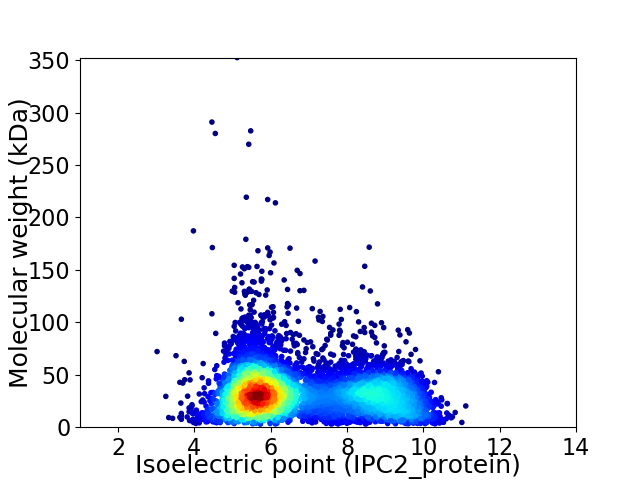
Virtual 2D-PAGE plot for 6389 proteins (isoelectric point calculated using IPC2_protein)
Get csv file with sequences according to given criteria:
* You can choose from 21 different methods for calculating isoelectric point
Summary statistics related to proteome-wise predictions


Protein with the lowest isoelectric point:
>tr|A0A1G6THB8|A0A1G6THB8_9BURK Uncharacterized protein OS=Paraburkholderia lycopersici OX=416944 GN=SAMN05421548_11725 PE=4 SV=1
MM1 pKa = 6.95STVSSTASTIASTVASTTSASNAALQAAAQSIISGSTNSTMDD43 pKa = 3.23VNSLVTALVNSKK55 pKa = 10.08IAGQAATIAAEE66 pKa = 3.97QSADD70 pKa = 3.39NTEE73 pKa = 3.54ISAYY77 pKa = 8.13GTLSAALSALQAAVLPLSNGSTISSFSTSLDD108 pKa = 3.24GTGITATAGAGAVASSYY125 pKa = 11.18SLNVQQIAQAQVLTSAAYY143 pKa = 8.0TGPLVSAGTATMTLTVNGASTTISLNNSNSTVAGIASAINSASNNPGVTATVVNGADD200 pKa = 3.7GAHH203 pKa = 6.3LVLHH207 pKa = 5.66STSTGSSNGIGISIKK222 pKa = 10.68DD223 pKa = 3.87SNTSDD228 pKa = 3.39ALNGLSVTTAAGTAITSSSADD249 pKa = 3.41SAALLANQSTIVSGTDD265 pKa = 3.12PTTGLAGWKK274 pKa = 9.78QSVAAQDD281 pKa = 3.66AYY283 pKa = 10.77LTVDD287 pKa = 3.3NTGVTSSSNTVTTGVSGVTLNLTSAAIGTTQTLTVSQDD325 pKa = 2.81TSTQSAQINNFVSLYY340 pKa = 7.92NTLVTTMGTLTSYY353 pKa = 11.37SSTSTSQGVLLGDD366 pKa = 3.34PTLNVIRR373 pKa = 11.84NQLASIVSSAVGTGTNAHH391 pKa = 5.77TLGAIGITLQSDD403 pKa = 4.26GSLSIDD409 pKa = 3.88SDD411 pKa = 4.01TLNNALANDD420 pKa = 3.64QSTLSTLFNSTNGIAAQLNKK440 pKa = 10.51NVTNYY445 pKa = 9.19TSSTGIIQNRR455 pKa = 11.84TDD457 pKa = 3.97ALNADD462 pKa = 4.21LTSLSNQQTTLSTWQDD478 pKa = 3.48QLTSMYY484 pKa = 10.15NAQFTALNTLMATMNNNTQYY504 pKa = 10.12LTQLFGGTNSAGALATAKK522 pKa = 10.45SS523 pKa = 3.6
MM1 pKa = 6.95STVSSTASTIASTVASTTSASNAALQAAAQSIISGSTNSTMDD43 pKa = 3.23VNSLVTALVNSKK55 pKa = 10.08IAGQAATIAAEE66 pKa = 3.97QSADD70 pKa = 3.39NTEE73 pKa = 3.54ISAYY77 pKa = 8.13GTLSAALSALQAAVLPLSNGSTISSFSTSLDD108 pKa = 3.24GTGITATAGAGAVASSYY125 pKa = 11.18SLNVQQIAQAQVLTSAAYY143 pKa = 8.0TGPLVSAGTATMTLTVNGASTTISLNNSNSTVAGIASAINSASNNPGVTATVVNGADD200 pKa = 3.7GAHH203 pKa = 6.3LVLHH207 pKa = 5.66STSTGSSNGIGISIKK222 pKa = 10.68DD223 pKa = 3.87SNTSDD228 pKa = 3.39ALNGLSVTTAAGTAITSSSADD249 pKa = 3.41SAALLANQSTIVSGTDD265 pKa = 3.12PTTGLAGWKK274 pKa = 9.78QSVAAQDD281 pKa = 3.66AYY283 pKa = 10.77LTVDD287 pKa = 3.3NTGVTSSSNTVTTGVSGVTLNLTSAAIGTTQTLTVSQDD325 pKa = 2.81TSTQSAQINNFVSLYY340 pKa = 7.92NTLVTTMGTLTSYY353 pKa = 11.37SSTSTSQGVLLGDD366 pKa = 3.34PTLNVIRR373 pKa = 11.84NQLASIVSSAVGTGTNAHH391 pKa = 5.77TLGAIGITLQSDD403 pKa = 4.26GSLSIDD409 pKa = 3.88SDD411 pKa = 4.01TLNNALANDD420 pKa = 3.64QSTLSTLFNSTNGIAAQLNKK440 pKa = 10.51NVTNYY445 pKa = 9.19TSSTGIIQNRR455 pKa = 11.84TDD457 pKa = 3.97ALNADD462 pKa = 4.21LTSLSNQQTTLSTWQDD478 pKa = 3.48QLTSMYY484 pKa = 10.15NAQFTALNTLMATMNNNTQYY504 pKa = 10.12LTQLFGGTNSAGALATAKK522 pKa = 10.45SS523 pKa = 3.6
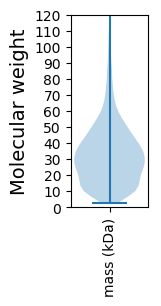
Molecular weight: 51.84 kDa
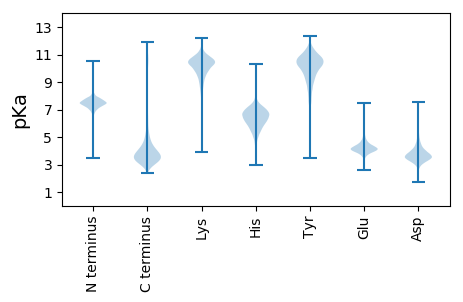
Isoelectric point according different methods:
Protein with the highest isoelectric point:
>tr|A0A1G7A040|A0A1G7A040_9BURK GMP synthase [glutamine-hydrolyzing] OS=Paraburkholderia lycopersici OX=416944 GN=guaA PE=3 SV=1
MM1 pKa = 7.12LTSSLLLLGVAAVLGQVAWTRR22 pKa = 11.84ARR24 pKa = 11.84ASLQPVRR31 pKa = 11.84VRR33 pKa = 11.84ATQPRR38 pKa = 11.84RR39 pKa = 11.84FRR41 pKa = 4.46
MM1 pKa = 7.12LTSSLLLLGVAAVLGQVAWTRR22 pKa = 11.84ARR24 pKa = 11.84ASLQPVRR31 pKa = 11.84VRR33 pKa = 11.84ATQPRR38 pKa = 11.84RR39 pKa = 11.84FRR41 pKa = 4.46
Molecular weight: 4.55 kDa
Isoelectric point according different methods:
Peptides (in silico digests for buttom-up proteomics)
Below you can find in silico digests of the whole proteome with Trypsin, Chymotrypsin, Trypsin+LysC, LysN, ArgC proteases suitable for different mass spec machines.| Try ESI |
 |
|---|
| ChTry ESI |
 |
|---|
| ArgC ESI |
 |
|---|
| LysN ESI |
 |
|---|
| TryLysC ESI |
 |
|---|
| Try MALDI |
 |
|---|
| ChTry MALDI |
 |
|---|
| ArgC MALDI |
 |
|---|
| LysN MALDI |
 |
|---|
| TryLysC MALDI |
 |
|---|
| Try LTQ |
 |
|---|
| ChTry LTQ |
 |
|---|
| ArgC LTQ |
 |
|---|
| LysN LTQ |
 |
|---|
| TryLysC LTQ |
 |
|---|
| Try MSlow |
 |
|---|
| ChTry MSlow |
 |
|---|
| ArgC MSlow |
 |
|---|
| LysN MSlow |
 |
|---|
| TryLysC MSlow |
 |
|---|
| Try MShigh |
 |
|---|
| ChTry MShigh |
 |
|---|
| ArgC MShigh |
 |
|---|
| LysN MShigh |
 |
|---|
| TryLysC MShigh |
 |
|---|
General Statistics
Number of major isoforms |
Number of additional isoforms |
Number of all proteins |
Number of amino acids |
Min. Seq. Length |
Max. Seq. Length |
Avg. Seq. Length |
Avg. Mol. Weight |
|---|---|---|---|---|---|---|---|
0 |
2038431 |
26 |
3320 |
319.1 |
34.6 |
Amino acid frequency
Ala |
Cys |
Asp |
Glu |
Phe |
Gly |
His |
Ile |
Lys |
Leu |
|---|---|---|---|---|---|---|---|---|---|
13.305 ± 0.046 | 0.971 ± 0.011 |
5.33 ± 0.023 | 5.275 ± 0.03 |
3.662 ± 0.02 | 8.267 ± 0.037 |
2.347 ± 0.015 | 4.494 ± 0.023 |
2.902 ± 0.021 | 10.204 ± 0.035 |
Met |
Asn |
Gln |
Pro |
Arg |
Ser |
Thr |
Val |
Trp |
Tyr |
|---|---|---|---|---|---|---|---|---|---|
2.308 ± 0.014 | 2.742 ± 0.02 |
5.127 ± 0.028 | 3.551 ± 0.02 |
7.291 ± 0.032 | 5.472 ± 0.026 |
5.245 ± 0.025 | 7.705 ± 0.024 |
1.393 ± 0.014 | 2.408 ± 0.016 |
Most of the basic statistics you can see at this page can be downloaded from this CSV file
Proteome-pI is available under Creative Commons Attribution-NoDerivs license, for more details see here
| Reference: Kozlowski LP. Proteome-pI 2.0: Proteome Isoelectric Point Database Update. Nucleic Acids Res. 2021, doi: 10.1093/nar/gkab944 | Contact: Lukasz P. Kozlowski |
