Klebsiella phage Henu1
Taxonomy: Viruses; Duplodnaviria; Heunggongvirae; Uroviricota; Caudoviricetes; Caudovirales; Autographiviridae; Studiervirinae; Przondovirus; Klebsiella virus Henu1
Average proteome isoelectric point is 6.79
Get precalculated fractions of proteins

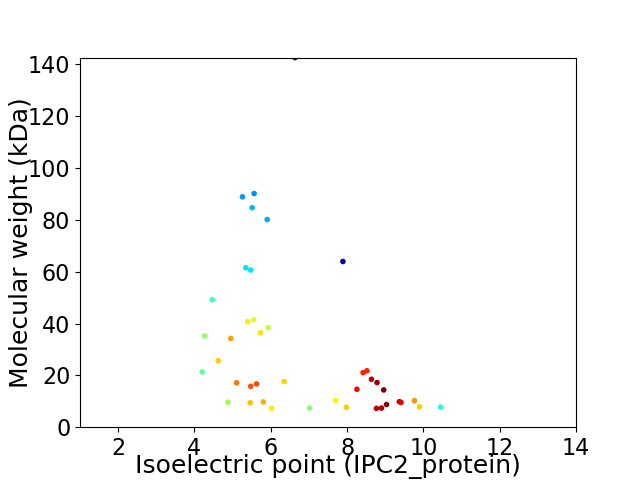
Virtual 2D-PAGE plot for 42 proteins (isoelectric point calculated using IPC2_protein)
Get csv file with sequences according to given criteria:
* You can choose from 21 different methods for calculating isoelectric point
Summary statistics related to proteome-wise predictions


Protein with the lowest isoelectric point:
>tr|A0A3S9U7X6|A0A3S9U7X6_9CAUD Putative primase/helicase protein OS=Klebsiella phage Henu1 OX=2492437 GN=Henu1_18 PE=4 SV=1
MM1 pKa = 7.38NMQDD5 pKa = 4.11AYY7 pKa = 10.62FGSAAEE13 pKa = 4.04LDD15 pKa = 4.97AINEE19 pKa = 3.9MLAAIGEE26 pKa = 4.7SPVTTLDD33 pKa = 3.33EE34 pKa = 5.18DD35 pKa = 4.25GSADD39 pKa = 3.27VANARR44 pKa = 11.84RR45 pKa = 11.84ILNRR49 pKa = 11.84INRR52 pKa = 11.84QIQSKK57 pKa = 9.61GWAFNINEE65 pKa = 4.55SATLTPDD72 pKa = 2.99ASTGLIPFRR81 pKa = 11.84PAYY84 pKa = 10.44LSILGGQYY92 pKa = 10.17VNRR95 pKa = 11.84GGWVYY100 pKa = 11.2DD101 pKa = 3.54KK102 pKa = 11.07STGTDD107 pKa = 3.14TFSGPITVTLITLQDD122 pKa = 3.68YY123 pKa = 11.66DD124 pKa = 4.32EE125 pKa = 4.72MPEE128 pKa = 5.08CFRR131 pKa = 11.84QWIVTKK137 pKa = 10.66ASRR140 pKa = 11.84QFNSRR145 pKa = 11.84FFGAEE150 pKa = 3.73DD151 pKa = 3.76VEE153 pKa = 4.46NSLAQEE159 pKa = 3.88EE160 pKa = 4.75MEE162 pKa = 5.66ARR164 pKa = 11.84MACNEE169 pKa = 3.84YY170 pKa = 10.91EE171 pKa = 4.14MDD173 pKa = 3.84FGQYY177 pKa = 11.01NMLDD181 pKa = 3.06GDD183 pKa = 4.58AYY185 pKa = 10.18VQGLIGRR192 pKa = 4.48
MM1 pKa = 7.38NMQDD5 pKa = 4.11AYY7 pKa = 10.62FGSAAEE13 pKa = 4.04LDD15 pKa = 4.97AINEE19 pKa = 3.9MLAAIGEE26 pKa = 4.7SPVTTLDD33 pKa = 3.33EE34 pKa = 5.18DD35 pKa = 4.25GSADD39 pKa = 3.27VANARR44 pKa = 11.84RR45 pKa = 11.84ILNRR49 pKa = 11.84INRR52 pKa = 11.84QIQSKK57 pKa = 9.61GWAFNINEE65 pKa = 4.55SATLTPDD72 pKa = 2.99ASTGLIPFRR81 pKa = 11.84PAYY84 pKa = 10.44LSILGGQYY92 pKa = 10.17VNRR95 pKa = 11.84GGWVYY100 pKa = 11.2DD101 pKa = 3.54KK102 pKa = 11.07STGTDD107 pKa = 3.14TFSGPITVTLITLQDD122 pKa = 3.68YY123 pKa = 11.66DD124 pKa = 4.32EE125 pKa = 4.72MPEE128 pKa = 5.08CFRR131 pKa = 11.84QWIVTKK137 pKa = 10.66ASRR140 pKa = 11.84QFNSRR145 pKa = 11.84FFGAEE150 pKa = 3.73DD151 pKa = 3.76VEE153 pKa = 4.46NSLAQEE159 pKa = 3.88EE160 pKa = 4.75MEE162 pKa = 5.66ARR164 pKa = 11.84MACNEE169 pKa = 3.84YY170 pKa = 10.91EE171 pKa = 4.14MDD173 pKa = 3.84FGQYY177 pKa = 11.01NMLDD181 pKa = 3.06GDD183 pKa = 4.58AYY185 pKa = 10.18VQGLIGRR192 pKa = 4.48
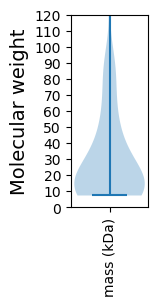
Molecular weight: 21.36 kDa
Isoelectric point according different methods:
Protein with the highest isoelectric point:
>tr|A0A3S9U857|A0A3S9U857_9CAUD Uncharacterized protein OS=Klebsiella phage Henu1 OX=2492437 GN=Henu1_27 PE=4 SV=1
MM1 pKa = 7.54SLTITIRR8 pKa = 11.84SNTMYY13 pKa = 10.74QNTINFEE20 pKa = 4.15RR21 pKa = 11.84TRR23 pKa = 11.84EE24 pKa = 3.91RR25 pKa = 11.84QQTEE29 pKa = 4.09GYY31 pKa = 8.84IPKK34 pKa = 10.01GRR36 pKa = 11.84KK37 pKa = 8.66LNKK40 pKa = 7.87TKK42 pKa = 10.66RR43 pKa = 11.84GGGVKK48 pKa = 10.48GSFRR52 pKa = 11.84NAKK55 pKa = 9.39GDD57 pKa = 3.7SVVNQEE63 pKa = 4.49KK64 pKa = 10.66YY65 pKa = 10.34FVGAA69 pKa = 4.14
MM1 pKa = 7.54SLTITIRR8 pKa = 11.84SNTMYY13 pKa = 10.74QNTINFEE20 pKa = 4.15RR21 pKa = 11.84TRR23 pKa = 11.84EE24 pKa = 3.91RR25 pKa = 11.84QQTEE29 pKa = 4.09GYY31 pKa = 8.84IPKK34 pKa = 10.01GRR36 pKa = 11.84KK37 pKa = 8.66LNKK40 pKa = 7.87TKK42 pKa = 10.66RR43 pKa = 11.84GGGVKK48 pKa = 10.48GSFRR52 pKa = 11.84NAKK55 pKa = 9.39GDD57 pKa = 3.7SVVNQEE63 pKa = 4.49KK64 pKa = 10.66YY65 pKa = 10.34FVGAA69 pKa = 4.14
Molecular weight: 7.86 kDa
Isoelectric point according different methods:
Peptides (in silico digests for buttom-up proteomics)
Below you can find in silico digests of the whole proteome with Trypsin, Chymotrypsin, Trypsin+LysC, LysN, ArgC proteases suitable for different mass spec machines.| Try ESI |
 |
|---|
| ChTry ESI |
 |
|---|
| ArgC ESI |
 |
|---|
| LysN ESI |
 |
|---|
| TryLysC ESI |
 |
|---|
| Try MALDI |
 |
|---|
| ChTry MALDI |
 |
|---|
| ArgC MALDI |
 |
|---|
| LysN MALDI |
 |
|---|
| TryLysC MALDI |
 |
|---|
| Try LTQ |
 |
|---|
| ChTry LTQ |
 |
|---|
| ArgC LTQ |
 |
|---|
| LysN LTQ |
 |
|---|
| TryLysC LTQ |
 |
|---|
| Try MSlow |
 |
|---|
| ChTry MSlow |
 |
|---|
| ArgC MSlow |
 |
|---|
| LysN MSlow |
 |
|---|
| TryLysC MSlow |
 |
|---|
| Try MShigh |
 |
|---|
| ChTry MShigh |
 |
|---|
| ArgC MShigh |
 |
|---|
| LysN MShigh |
 |
|---|
| TryLysC MShigh |
 |
|---|
General Statistics
Number of major isoforms |
Number of additional isoforms |
Number of all proteins |
Number of amino acids |
Min. Seq. Length |
Max. Seq. Length |
Avg. Seq. Length |
Avg. Mol. Weight |
|---|---|---|---|---|---|---|---|
0 |
11724 |
67 |
1321 |
279.1 |
30.96 |
Amino acid frequency
Ala |
Cys |
Asp |
Glu |
Phe |
Gly |
His |
Ile |
Lys |
Leu |
|---|---|---|---|---|---|---|---|---|---|
9.118 ± 0.507 | 1.032 ± 0.192 |
6.329 ± 0.23 | 6.798 ± 0.443 |
3.574 ± 0.199 | 8.265 ± 0.383 |
1.825 ± 0.211 | 4.922 ± 0.2 |
6.508 ± 0.426 | 7.847 ± 0.415 |
Met |
Asn |
Gln |
Pro |
Arg |
Ser |
Thr |
Val |
Trp |
Tyr |
|---|---|---|---|---|---|---|---|---|---|
2.602 ± 0.181 | 4.145 ± 0.247 |
3.77 ± 0.191 | 4.282 ± 0.346 |
5.604 ± 0.236 | 6.244 ± 0.403 |
5.553 ± 0.29 | 6.738 ± 0.343 |
1.382 ± 0.198 | 3.446 ± 0.2 |
Most of the basic statistics you can see at this page can be downloaded from this CSV file
Proteome-pI is available under Creative Commons Attribution-NoDerivs license, for more details see here
| Reference: Kozlowski LP. Proteome-pI 2.0: Proteome Isoelectric Point Database Update. Nucleic Acids Res. 2021, doi: 10.1093/nar/gkab944 | Contact: Lukasz P. Kozlowski |
