Salinimonas sp. KX18D6
Taxonomy: cellular organisms; Bacteria; Proteobacteria; Gammaproteobacteria; Alteromonadales; Alteromonadaceae; Salinimonas
Average proteome isoelectric point is 6.09
Get precalculated fractions of proteins

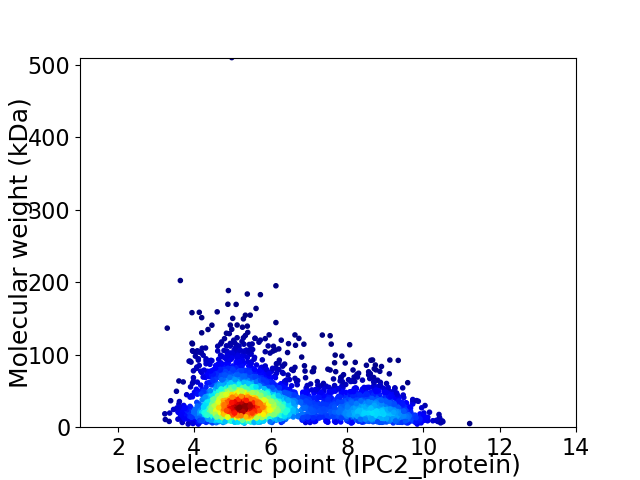
Virtual 2D-PAGE plot for 3632 proteins (isoelectric point calculated using IPC2_protein)
Get csv file with sequences according to given criteria:
* You can choose from 21 different methods for calculating isoelectric point
Summary statistics related to proteome-wise predictions


Protein with the lowest isoelectric point:
>tr|A0A5B7Y9F5|A0A5B7Y9F5_9ALTE AbgT family transporter OS=Salinimonas sp. KX18D6 OX=2572577 GN=FBQ74_01685 PE=4 SV=1
MM1 pKa = 7.59KK2 pKa = 10.32LAILSSMFALSVVTSGLAAAYY23 pKa = 7.22EE24 pKa = 4.0QGDD27 pKa = 3.58IVIRR31 pKa = 11.84GGATTVAPDD40 pKa = 3.63EE41 pKa = 4.39STSTIMAGGTDD52 pKa = 3.88LGVDD56 pKa = 3.72LTIDD60 pKa = 3.56SNTQLGLNIAYY71 pKa = 9.92FLTDD75 pKa = 4.71RR76 pKa = 11.84INLEE80 pKa = 4.31LLVATPFKK88 pKa = 10.67HH89 pKa = 7.42DD90 pKa = 3.18VDD92 pKa = 4.74FGVADD97 pKa = 3.93PLGTGNQLGEE107 pKa = 4.42VTHH110 pKa = 6.84LPPTLTVNYY119 pKa = 9.11YY120 pKa = 10.35FNDD123 pKa = 3.75SASVLQPYY131 pKa = 9.56VGAGVNYY138 pKa = 8.71TFIYY142 pKa = 10.72DD143 pKa = 3.95EE144 pKa = 4.79EE145 pKa = 4.31FTGANRR151 pKa = 11.84EE152 pKa = 4.18AGLSDD157 pKa = 4.6LSLDD161 pKa = 3.61NSVGLSAQIGLDD173 pKa = 4.13VMLADD178 pKa = 3.36NWHH181 pKa = 6.79INTSVRR187 pKa = 11.84WIDD190 pKa = 2.99IDD192 pKa = 3.78TEE194 pKa = 4.13ASFKK198 pKa = 10.97VGEE201 pKa = 4.16ASGQVSSIEE210 pKa = 3.77IDD212 pKa = 2.98PWVYY216 pKa = 9.84TLSLGYY222 pKa = 9.02TFF224 pKa = 5.75
MM1 pKa = 7.59KK2 pKa = 10.32LAILSSMFALSVVTSGLAAAYY23 pKa = 7.22EE24 pKa = 4.0QGDD27 pKa = 3.58IVIRR31 pKa = 11.84GGATTVAPDD40 pKa = 3.63EE41 pKa = 4.39STSTIMAGGTDD52 pKa = 3.88LGVDD56 pKa = 3.72LTIDD60 pKa = 3.56SNTQLGLNIAYY71 pKa = 9.92FLTDD75 pKa = 4.71RR76 pKa = 11.84INLEE80 pKa = 4.31LLVATPFKK88 pKa = 10.67HH89 pKa = 7.42DD90 pKa = 3.18VDD92 pKa = 4.74FGVADD97 pKa = 3.93PLGTGNQLGEE107 pKa = 4.42VTHH110 pKa = 6.84LPPTLTVNYY119 pKa = 9.11YY120 pKa = 10.35FNDD123 pKa = 3.75SASVLQPYY131 pKa = 9.56VGAGVNYY138 pKa = 8.71TFIYY142 pKa = 10.72DD143 pKa = 3.95EE144 pKa = 4.79EE145 pKa = 4.31FTGANRR151 pKa = 11.84EE152 pKa = 4.18AGLSDD157 pKa = 4.6LSLDD161 pKa = 3.61NSVGLSAQIGLDD173 pKa = 4.13VMLADD178 pKa = 3.36NWHH181 pKa = 6.79INTSVRR187 pKa = 11.84WIDD190 pKa = 2.99IDD192 pKa = 3.78TEE194 pKa = 4.13ASFKK198 pKa = 10.97VGEE201 pKa = 4.16ASGQVSSIEE210 pKa = 3.77IDD212 pKa = 2.98PWVYY216 pKa = 9.84TLSLGYY222 pKa = 9.02TFF224 pKa = 5.75
Molecular weight: 23.9 kDa
Isoelectric point according different methods:
Protein with the highest isoelectric point:
>tr|A0A5B7YIK3|A0A5B7YIK3_9ALTE Translational regulator CsrA OS=Salinimonas sp. KX18D6 OX=2572577 GN=csrA PE=3 SV=1
MM1 pKa = 7.45KK2 pKa = 9.61RR3 pKa = 11.84TFQPSNLKK11 pKa = 10.14RR12 pKa = 11.84KK13 pKa = 9.13RR14 pKa = 11.84SHH16 pKa = 6.17GFRR19 pKa = 11.84ARR21 pKa = 11.84MATKK25 pKa = 10.37NGRR28 pKa = 11.84KK29 pKa = 9.16VLAARR34 pKa = 11.84RR35 pKa = 11.84AKK37 pKa = 10.29GRR39 pKa = 11.84ARR41 pKa = 11.84LSAA44 pKa = 3.91
MM1 pKa = 7.45KK2 pKa = 9.61RR3 pKa = 11.84TFQPSNLKK11 pKa = 10.14RR12 pKa = 11.84KK13 pKa = 9.13RR14 pKa = 11.84SHH16 pKa = 6.17GFRR19 pKa = 11.84ARR21 pKa = 11.84MATKK25 pKa = 10.37NGRR28 pKa = 11.84KK29 pKa = 9.16VLAARR34 pKa = 11.84RR35 pKa = 11.84AKK37 pKa = 10.29GRR39 pKa = 11.84ARR41 pKa = 11.84LSAA44 pKa = 3.91
Molecular weight: 5.07 kDa
Isoelectric point according different methods:
Peptides (in silico digests for buttom-up proteomics)
Below you can find in silico digests of the whole proteome with Trypsin, Chymotrypsin, Trypsin+LysC, LysN, ArgC proteases suitable for different mass spec machines.| Try ESI |
 |
|---|
| ChTry ESI |
 |
|---|
| ArgC ESI |
 |
|---|
| LysN ESI |
 |
|---|
| TryLysC ESI |
 |
|---|
| Try MALDI |
 |
|---|
| ChTry MALDI |
 |
|---|
| ArgC MALDI |
 |
|---|
| LysN MALDI |
 |
|---|
| TryLysC MALDI |
 |
|---|
| Try LTQ |
 |
|---|
| ChTry LTQ |
 |
|---|
| ArgC LTQ |
 |
|---|
| LysN LTQ |
 |
|---|
| TryLysC LTQ |
 |
|---|
| Try MSlow |
 |
|---|
| ChTry MSlow |
 |
|---|
| ArgC MSlow |
 |
|---|
| LysN MSlow |
 |
|---|
| TryLysC MSlow |
 |
|---|
| Try MShigh |
 |
|---|
| ChTry MShigh |
 |
|---|
| ArgC MShigh |
 |
|---|
| LysN MShigh |
 |
|---|
| TryLysC MShigh |
 |
|---|
General Statistics
Number of major isoforms |
Number of additional isoforms |
Number of all proteins |
Number of amino acids |
Min. Seq. Length |
Max. Seq. Length |
Avg. Seq. Length |
Avg. Mol. Weight |
|---|---|---|---|---|---|---|---|
0 |
1210490 |
37 |
4582 |
333.3 |
37.0 |
Amino acid frequency
Ala |
Cys |
Asp |
Glu |
Phe |
Gly |
His |
Ile |
Lys |
Leu |
|---|---|---|---|---|---|---|---|---|---|
9.12 ± 0.044 | 0.973 ± 0.014 |
5.963 ± 0.039 | 6.181 ± 0.041 |
4.108 ± 0.028 | 6.738 ± 0.043 |
2.283 ± 0.022 | 5.907 ± 0.03 |
4.9 ± 0.035 | 9.998 ± 0.045 |
Met |
Asn |
Gln |
Pro |
Arg |
Ser |
Thr |
Val |
Trp |
Tyr |
|---|---|---|---|---|---|---|---|---|---|
2.581 ± 0.02 | 4.085 ± 0.026 |
4.023 ± 0.02 | 4.568 ± 0.029 |
4.974 ± 0.032 | 6.683 ± 0.029 |
5.564 ± 0.025 | 7.012 ± 0.03 |
1.262 ± 0.016 | 3.077 ± 0.023 |
Most of the basic statistics you can see at this page can be downloaded from this CSV file
Proteome-pI is available under Creative Commons Attribution-NoDerivs license, for more details see here
| Reference: Kozlowski LP. Proteome-pI 2.0: Proteome Isoelectric Point Database Update. Nucleic Acids Res. 2021, doi: 10.1093/nar/gkab944 | Contact: Lukasz P. Kozlowski |
