Culicoidibacter larvae
Taxonomy: cellular organisms; Bacteria; Terrabacteria group; Firmicutes; Culicoidibacteria; Culicoidibacterales; Culicoidibacteraceae; Culicoidibacter
Average proteome isoelectric point is 5.84
Get precalculated fractions of proteins

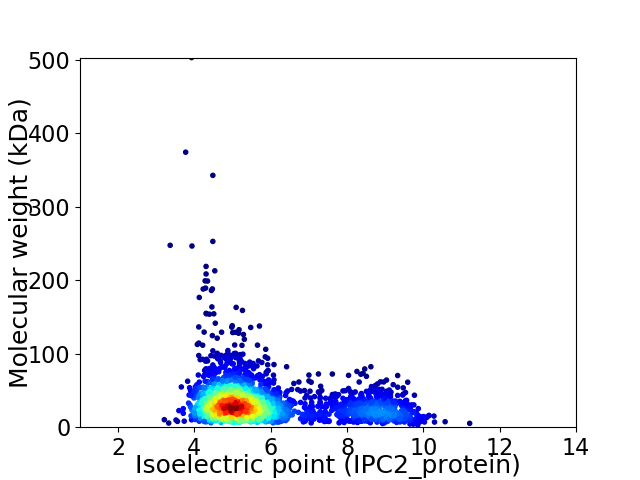
Virtual 2D-PAGE plot for 2363 proteins (isoelectric point calculated using IPC2_protein)
Get csv file with sequences according to given criteria:
* You can choose from 21 different methods for calculating isoelectric point
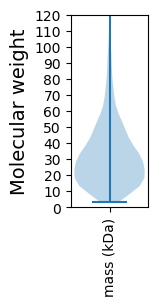
Summary statistics related to proteome-wise predictions


Protein with the lowest isoelectric point:
>tr|A0A5R8Q859|A0A5R8Q859_9FIRM Histidine kinase OS=Culicoidibacter larvae OX=2579976 GN=FEZ08_10190 PE=4 SV=1
MM1 pKa = 7.31KK2 pKa = 10.32LVRR5 pKa = 11.84VTLLAIAASLLLAACGKK22 pKa = 9.76PIIEE26 pKa = 5.07RR27 pKa = 11.84DD28 pKa = 3.35AQYY31 pKa = 11.61QMGDD35 pKa = 3.42FAVTEE40 pKa = 3.97NAEE43 pKa = 4.31FGVSATEE50 pKa = 4.22VILEE54 pKa = 4.29EE55 pKa = 5.68GDD57 pKa = 4.14DD58 pKa = 3.9GVEE61 pKa = 3.98QVVVDD66 pKa = 3.94IMIVNNSLDD75 pKa = 3.34IFNVSDD81 pKa = 4.94LDD83 pKa = 3.36IDD85 pKa = 4.47YY86 pKa = 7.22YY87 pKa = 11.0TPTGEE92 pKa = 4.07EE93 pKa = 3.98LEE95 pKa = 4.45YY96 pKa = 10.92TSVKK100 pKa = 10.85DD101 pKa = 3.36PGEE104 pKa = 3.99NYY106 pKa = 8.76MLPGGNTLATLFLKK120 pKa = 9.53YY121 pKa = 9.31TEE123 pKa = 5.12DD124 pKa = 2.95GTYY127 pKa = 10.82YY128 pKa = 11.17LNFLDD133 pKa = 4.36ATDD136 pKa = 4.75KK137 pKa = 8.87EE138 pKa = 4.5TLYY141 pKa = 11.08AIEE144 pKa = 4.21VKK146 pKa = 10.35KK147 pKa = 11.35GEE149 pKa = 4.49VIEE152 pKa = 4.32KK153 pKa = 10.4ALPEE157 pKa = 4.19VTNTASADD165 pKa = 3.37LGSNVEE171 pKa = 4.26KK172 pKa = 10.87GVASGLGNLEE182 pKa = 4.03FTFGTTNIYY191 pKa = 9.12TLTSFGSDD199 pKa = 2.74QLYY202 pKa = 10.69YY203 pKa = 10.78GVEE206 pKa = 3.7LTIRR210 pKa = 11.84NTGSDD215 pKa = 3.06AVNFDD220 pKa = 4.05GYY222 pKa = 11.14SFYY225 pKa = 10.87QIYY228 pKa = 8.95TYY230 pKa = 11.02QDD232 pKa = 3.15NTVSFSSVMNQIGSDD247 pKa = 3.7DD248 pKa = 4.69DD249 pKa = 4.22DD250 pKa = 3.86VLEE253 pKa = 4.8IGEE256 pKa = 4.48VTTLEE261 pKa = 4.26AGEE264 pKa = 4.5SKK266 pKa = 10.78AVTLMVSSSPSAGKK280 pKa = 10.08DD281 pKa = 2.85LFARR285 pKa = 11.84YY286 pKa = 9.47IEE288 pKa = 4.01ITFDD292 pKa = 3.65GEE294 pKa = 4.05KK295 pKa = 8.92ITYY298 pKa = 9.8KK299 pKa = 10.69FF300 pKa = 3.42
MM1 pKa = 7.31KK2 pKa = 10.32LVRR5 pKa = 11.84VTLLAIAASLLLAACGKK22 pKa = 9.76PIIEE26 pKa = 5.07RR27 pKa = 11.84DD28 pKa = 3.35AQYY31 pKa = 11.61QMGDD35 pKa = 3.42FAVTEE40 pKa = 3.97NAEE43 pKa = 4.31FGVSATEE50 pKa = 4.22VILEE54 pKa = 4.29EE55 pKa = 5.68GDD57 pKa = 4.14DD58 pKa = 3.9GVEE61 pKa = 3.98QVVVDD66 pKa = 3.94IMIVNNSLDD75 pKa = 3.34IFNVSDD81 pKa = 4.94LDD83 pKa = 3.36IDD85 pKa = 4.47YY86 pKa = 7.22YY87 pKa = 11.0TPTGEE92 pKa = 4.07EE93 pKa = 3.98LEE95 pKa = 4.45YY96 pKa = 10.92TSVKK100 pKa = 10.85DD101 pKa = 3.36PGEE104 pKa = 3.99NYY106 pKa = 8.76MLPGGNTLATLFLKK120 pKa = 9.53YY121 pKa = 9.31TEE123 pKa = 5.12DD124 pKa = 2.95GTYY127 pKa = 10.82YY128 pKa = 11.17LNFLDD133 pKa = 4.36ATDD136 pKa = 4.75KK137 pKa = 8.87EE138 pKa = 4.5TLYY141 pKa = 11.08AIEE144 pKa = 4.21VKK146 pKa = 10.35KK147 pKa = 11.35GEE149 pKa = 4.49VIEE152 pKa = 4.32KK153 pKa = 10.4ALPEE157 pKa = 4.19VTNTASADD165 pKa = 3.37LGSNVEE171 pKa = 4.26KK172 pKa = 10.87GVASGLGNLEE182 pKa = 4.03FTFGTTNIYY191 pKa = 9.12TLTSFGSDD199 pKa = 2.74QLYY202 pKa = 10.69YY203 pKa = 10.78GVEE206 pKa = 3.7LTIRR210 pKa = 11.84NTGSDD215 pKa = 3.06AVNFDD220 pKa = 4.05GYY222 pKa = 11.14SFYY225 pKa = 10.87QIYY228 pKa = 8.95TYY230 pKa = 11.02QDD232 pKa = 3.15NTVSFSSVMNQIGSDD247 pKa = 3.7DD248 pKa = 4.69DD249 pKa = 4.22DD250 pKa = 3.86VLEE253 pKa = 4.8IGEE256 pKa = 4.48VTTLEE261 pKa = 4.26AGEE264 pKa = 4.5SKK266 pKa = 10.78AVTLMVSSSPSAGKK280 pKa = 10.08DD281 pKa = 2.85LFARR285 pKa = 11.84YY286 pKa = 9.47IEE288 pKa = 4.01ITFDD292 pKa = 3.65GEE294 pKa = 4.05KK295 pKa = 8.92ITYY298 pKa = 9.8KK299 pKa = 10.69FF300 pKa = 3.42
Molecular weight: 32.77 kDa
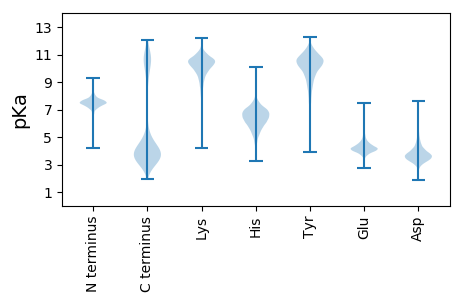
Isoelectric point according different methods:
Protein with the highest isoelectric point:
>tr|A0A5R8QHH0|A0A5R8QHH0_9FIRM Uncharacterized protein OS=Culicoidibacter larvae OX=2579976 GN=FEZ08_01105 PE=4 SV=1
MM1 pKa = 7.44KK2 pKa = 9.59RR3 pKa = 11.84TFQPNKK9 pKa = 8.79RR10 pKa = 11.84KK11 pKa = 9.75RR12 pKa = 11.84SKK14 pKa = 10.38KK15 pKa = 8.31HH16 pKa = 4.52GFRR19 pKa = 11.84ARR21 pKa = 11.84ISTPTGRR28 pKa = 11.84NILKK32 pKa = 10.13RR33 pKa = 11.84RR34 pKa = 11.84RR35 pKa = 11.84LKK37 pKa = 10.41GRR39 pKa = 11.84KK40 pKa = 8.78VLSAA44 pKa = 4.05
MM1 pKa = 7.44KK2 pKa = 9.59RR3 pKa = 11.84TFQPNKK9 pKa = 8.79RR10 pKa = 11.84KK11 pKa = 9.75RR12 pKa = 11.84SKK14 pKa = 10.38KK15 pKa = 8.31HH16 pKa = 4.52GFRR19 pKa = 11.84ARR21 pKa = 11.84ISTPTGRR28 pKa = 11.84NILKK32 pKa = 10.13RR33 pKa = 11.84RR34 pKa = 11.84RR35 pKa = 11.84LKK37 pKa = 10.41GRR39 pKa = 11.84KK40 pKa = 8.78VLSAA44 pKa = 4.05
Molecular weight: 5.26 kDa
Isoelectric point according different methods:
Peptides (in silico digests for buttom-up proteomics)
Below you can find in silico digests of the whole proteome with Trypsin, Chymotrypsin, Trypsin+LysC, LysN, ArgC proteases suitable for different mass spec machines.| Try ESI |
 |
|---|
| ChTry ESI |
 |
|---|
| ArgC ESI |
 |
|---|
| LysN ESI |
 |
|---|
| TryLysC ESI |
 |
|---|
| Try MALDI |
 |
|---|
| ChTry MALDI |
 |
|---|
| ArgC MALDI |
 |
|---|
| LysN MALDI |
 |
|---|
| TryLysC MALDI |
 |
|---|
| Try LTQ |
 |
|---|
| ChTry LTQ |
 |
|---|
| ArgC LTQ |
 |
|---|
| LysN LTQ |
 |
|---|
| TryLysC LTQ |
 |
|---|
| Try MSlow |
 |
|---|
| ChTry MSlow |
 |
|---|
| ArgC MSlow |
 |
|---|
| LysN MSlow |
 |
|---|
| TryLysC MSlow |
 |
|---|
| Try MShigh |
 |
|---|
| ChTry MShigh |
 |
|---|
| ArgC MShigh |
 |
|---|
| LysN MShigh |
 |
|---|
| TryLysC MShigh |
 |
|---|
General Statistics
Number of major isoforms |
Number of additional isoforms |
Number of all proteins |
Number of amino acids |
Min. Seq. Length |
Max. Seq. Length |
Avg. Seq. Length |
Avg. Mol. Weight |
|---|---|---|---|---|---|---|---|
0 |
740341 |
26 |
4917 |
313.3 |
34.96 |
Amino acid frequency
Ala |
Cys |
Asp |
Glu |
Phe |
Gly |
His |
Ile |
Lys |
Leu |
|---|---|---|---|---|---|---|---|---|---|
8.046 ± 0.062 | 0.729 ± 0.016 |
5.803 ± 0.042 | 6.513 ± 0.057 |
4.502 ± 0.046 | 6.616 ± 0.058 |
1.754 ± 0.028 | 8.1 ± 0.056 |
5.756 ± 0.044 | 9.18 ± 0.072 |
Met |
Asn |
Gln |
Pro |
Arg |
Ser |
Thr |
Val |
Trp |
Tyr |
|---|---|---|---|---|---|---|---|---|---|
2.621 ± 0.03 | 5.096 ± 0.054 |
3.301 ± 0.032 | 3.897 ± 0.043 |
3.723 ± 0.047 | 5.924 ± 0.044 |
6.113 ± 0.1 | 7.351 ± 0.058 |
0.921 ± 0.017 | 4.055 ± 0.043 |
Most of the basic statistics you can see at this page can be downloaded from this CSV file
Proteome-pI is available under Creative Commons Attribution-NoDerivs license, for more details see here
| Reference: Kozlowski LP. Proteome-pI 2.0: Proteome Isoelectric Point Database Update. Nucleic Acids Res. 2021, doi: 10.1093/nar/gkab944 | Contact: Lukasz P. Kozlowski |
