Mycolicibacterium agri (Mycobacterium agri)
Taxonomy: cellular organisms; Bacteria; Terrabacteria group; Actinobacteria;
Average proteome isoelectric point is 6.04
Get precalculated fractions of proteins

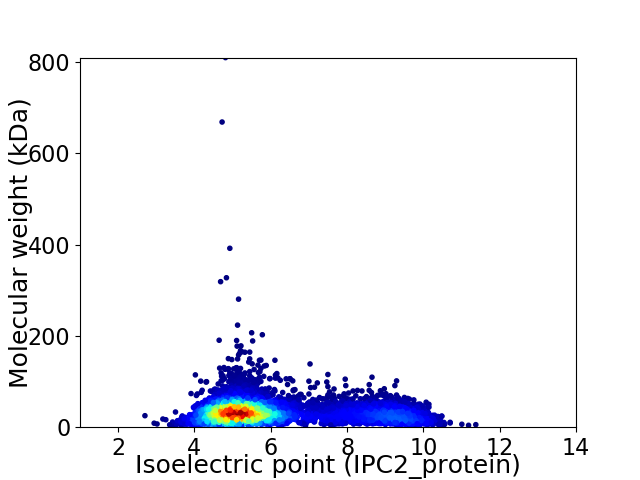
Virtual 2D-PAGE plot for 6452 proteins (isoelectric point calculated using IPC2_protein)
Get csv file with sequences according to given criteria:
* You can choose from 21 different methods for calculating isoelectric point
Summary statistics related to proteome-wise predictions


Protein with the lowest isoelectric point:
>tr|A0A2A7N8R5|A0A2A7N8R5_MYCAG Hydrogenase maturation factor HypA OS=Mycolicibacterium agri OX=36811 GN=hypA PE=3 SV=1
MM1 pKa = 7.9RR2 pKa = 11.84LPRR5 pKa = 11.84AVVAAAAAVLLAAAGCTTEE24 pKa = 4.05VTGTAVQDD32 pKa = 3.67LRR34 pKa = 11.84QPPLGLSEE42 pKa = 4.93DD43 pKa = 3.71GSGIVAGYY51 pKa = 9.56PDD53 pKa = 5.05APVQLEE59 pKa = 4.8VYY61 pKa = 9.42TEE63 pKa = 4.08PQCTHH68 pKa = 6.52CADD71 pKa = 4.38FQAEE75 pKa = 4.22FGDD78 pKa = 5.0DD79 pKa = 2.67IHH81 pKa = 8.79RR82 pKa = 11.84YY83 pKa = 9.21INLGQLAVTYY93 pKa = 10.41RR94 pKa = 11.84PLTFLDD100 pKa = 3.18EE101 pKa = 5.18GYY103 pKa = 9.39TDD105 pKa = 3.4GHH107 pKa = 5.54SARR110 pKa = 11.84VANAMFLAVGVPAEE124 pKa = 4.19AADD127 pKa = 3.98GDD129 pKa = 4.64FATGPEE135 pKa = 4.07FQRR138 pKa = 11.84FVQEE142 pKa = 3.68LWANQDD148 pKa = 3.3PGGPGPSDD156 pKa = 4.36ADD158 pKa = 3.46MADD161 pKa = 3.37MAKK164 pKa = 10.4AAGMPDD170 pKa = 3.71DD171 pKa = 3.95VAAQIGDD178 pKa = 3.9GEE180 pKa = 4.43VAPNVDD186 pKa = 3.06IAEE189 pKa = 4.23AAIFNYY195 pKa = 10.0GALIGVDD202 pKa = 4.66PITTGTPTVYY212 pKa = 10.75DD213 pKa = 3.9LDD215 pKa = 3.82MQEE218 pKa = 5.35KK219 pKa = 10.58INIQDD224 pKa = 4.67DD225 pKa = 3.77DD226 pKa = 4.08WLDD229 pKa = 3.62TLMSSAA235 pKa = 4.71
MM1 pKa = 7.9RR2 pKa = 11.84LPRR5 pKa = 11.84AVVAAAAAVLLAAAGCTTEE24 pKa = 4.05VTGTAVQDD32 pKa = 3.67LRR34 pKa = 11.84QPPLGLSEE42 pKa = 4.93DD43 pKa = 3.71GSGIVAGYY51 pKa = 9.56PDD53 pKa = 5.05APVQLEE59 pKa = 4.8VYY61 pKa = 9.42TEE63 pKa = 4.08PQCTHH68 pKa = 6.52CADD71 pKa = 4.38FQAEE75 pKa = 4.22FGDD78 pKa = 5.0DD79 pKa = 2.67IHH81 pKa = 8.79RR82 pKa = 11.84YY83 pKa = 9.21INLGQLAVTYY93 pKa = 10.41RR94 pKa = 11.84PLTFLDD100 pKa = 3.18EE101 pKa = 5.18GYY103 pKa = 9.39TDD105 pKa = 3.4GHH107 pKa = 5.54SARR110 pKa = 11.84VANAMFLAVGVPAEE124 pKa = 4.19AADD127 pKa = 3.98GDD129 pKa = 4.64FATGPEE135 pKa = 4.07FQRR138 pKa = 11.84FVQEE142 pKa = 3.68LWANQDD148 pKa = 3.3PGGPGPSDD156 pKa = 4.36ADD158 pKa = 3.46MADD161 pKa = 3.37MAKK164 pKa = 10.4AAGMPDD170 pKa = 3.71DD171 pKa = 3.95VAAQIGDD178 pKa = 3.9GEE180 pKa = 4.43VAPNVDD186 pKa = 3.06IAEE189 pKa = 4.23AAIFNYY195 pKa = 10.0GALIGVDD202 pKa = 4.66PITTGTPTVYY212 pKa = 10.75DD213 pKa = 3.9LDD215 pKa = 3.82MQEE218 pKa = 5.35KK219 pKa = 10.58INIQDD224 pKa = 4.67DD225 pKa = 3.77DD226 pKa = 4.08WLDD229 pKa = 3.62TLMSSAA235 pKa = 4.71
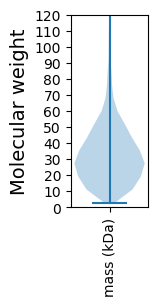
Molecular weight: 24.67 kDa
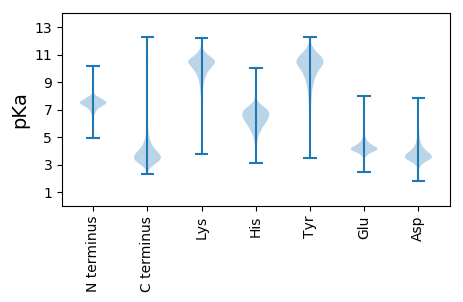
Isoelectric point according different methods:
Protein with the highest isoelectric point:
>tr|A0A2A7N5W8|A0A2A7N5W8_MYCAG Cytoplasmic protein OS=Mycolicibacterium agri OX=36811 GN=CQY20_09775 PE=4 SV=1
MM1 pKa = 7.69AKK3 pKa = 10.06GKK5 pKa = 8.69RR6 pKa = 11.84TFQPNNRR13 pKa = 11.84RR14 pKa = 11.84RR15 pKa = 11.84ARR17 pKa = 11.84VHH19 pKa = 5.99GFRR22 pKa = 11.84LRR24 pKa = 11.84MRR26 pKa = 11.84TRR28 pKa = 11.84AGRR31 pKa = 11.84AIVSNRR37 pKa = 11.84RR38 pKa = 11.84RR39 pKa = 11.84KK40 pKa = 9.47GRR42 pKa = 11.84RR43 pKa = 11.84ALSAA47 pKa = 3.69
MM1 pKa = 7.69AKK3 pKa = 10.06GKK5 pKa = 8.69RR6 pKa = 11.84TFQPNNRR13 pKa = 11.84RR14 pKa = 11.84RR15 pKa = 11.84ARR17 pKa = 11.84VHH19 pKa = 5.99GFRR22 pKa = 11.84LRR24 pKa = 11.84MRR26 pKa = 11.84TRR28 pKa = 11.84AGRR31 pKa = 11.84AIVSNRR37 pKa = 11.84RR38 pKa = 11.84RR39 pKa = 11.84KK40 pKa = 9.47GRR42 pKa = 11.84RR43 pKa = 11.84ALSAA47 pKa = 3.69
Molecular weight: 5.58 kDa
Isoelectric point according different methods:
Peptides (in silico digests for buttom-up proteomics)
Below you can find in silico digests of the whole proteome with Trypsin, Chymotrypsin, Trypsin+LysC, LysN, ArgC proteases suitable for different mass spec machines.| Try ESI |
 |
|---|
| ChTry ESI |
 |
|---|
| ArgC ESI |
 |
|---|
| LysN ESI |
 |
|---|
| TryLysC ESI |
 |
|---|
| Try MALDI |
 |
|---|
| ChTry MALDI |
 |
|---|
| ArgC MALDI |
 |
|---|
| LysN MALDI |
 |
|---|
| TryLysC MALDI |
 |
|---|
| Try LTQ |
 |
|---|
| ChTry LTQ |
 |
|---|
| ArgC LTQ |
 |
|---|
| LysN LTQ |
 |
|---|
| TryLysC LTQ |
 |
|---|
| Try MSlow |
 |
|---|
| ChTry MSlow |
 |
|---|
| ArgC MSlow |
 |
|---|
| LysN MSlow |
 |
|---|
| TryLysC MSlow |
 |
|---|
| Try MShigh |
 |
|---|
| ChTry MShigh |
 |
|---|
| ArgC MShigh |
 |
|---|
| LysN MShigh |
 |
|---|
| TryLysC MShigh |
 |
|---|
General Statistics
Number of major isoforms |
Number of additional isoforms |
Number of all proteins |
Number of amino acids |
Min. Seq. Length |
Max. Seq. Length |
Avg. Seq. Length |
Avg. Mol. Weight |
|---|---|---|---|---|---|---|---|
0 |
2059546 |
24 |
7553 |
319.2 |
34.41 |
Amino acid frequency
Ala |
Cys |
Asp |
Glu |
Phe |
Gly |
His |
Ile |
Lys |
Leu |
|---|---|---|---|---|---|---|---|---|---|
12.766 ± 0.046 | 0.846 ± 0.008 |
6.304 ± 0.029 | 5.481 ± 0.028 |
3.102 ± 0.019 | 8.596 ± 0.029 |
2.188 ± 0.013 | 4.473 ± 0.02 |
2.386 ± 0.022 | 9.769 ± 0.031 |
Met |
Asn |
Gln |
Pro |
Arg |
Ser |
Thr |
Val |
Trp |
Tyr |
|---|---|---|---|---|---|---|---|---|---|
2.108 ± 0.013 | 2.321 ± 0.014 |
5.786 ± 0.028 | 2.97 ± 0.016 |
7.263 ± 0.03 | 5.296 ± 0.019 |
5.96 ± 0.022 | 8.68 ± 0.031 |
1.503 ± 0.012 | 2.202 ± 0.014 |
Most of the basic statistics you can see at this page can be downloaded from this CSV file
Proteome-pI is available under Creative Commons Attribution-NoDerivs license, for more details see here
| Reference: Kozlowski LP. Proteome-pI 2.0: Proteome Isoelectric Point Database Update. Nucleic Acids Res. 2021, doi: 10.1093/nar/gkab944 | Contact: Lukasz P. Kozlowski |
