Brevibacillus centrosporus
Taxonomy: cellular organisms; Bacteria; Terrabacteria group; Firmicutes; Bacilli; Bacillales; Paenibacillaceae; Brevibacillus
Average proteome isoelectric point is 6.35
Get precalculated fractions of proteins
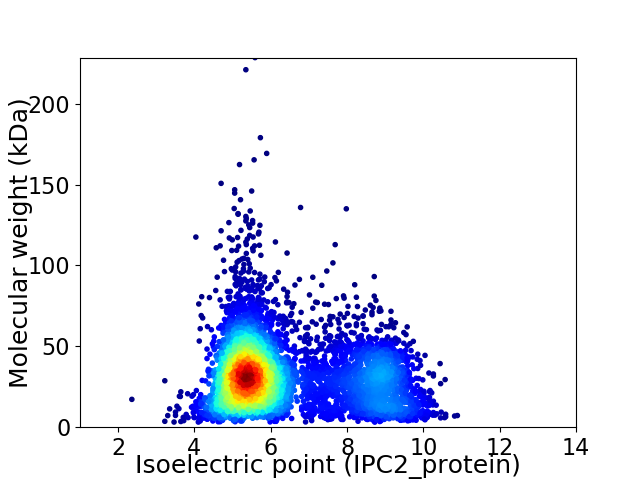
Virtual 2D-PAGE plot for 5729 proteins (isoelectric point calculated using IPC2_protein)
Get csv file with sequences according to given criteria:
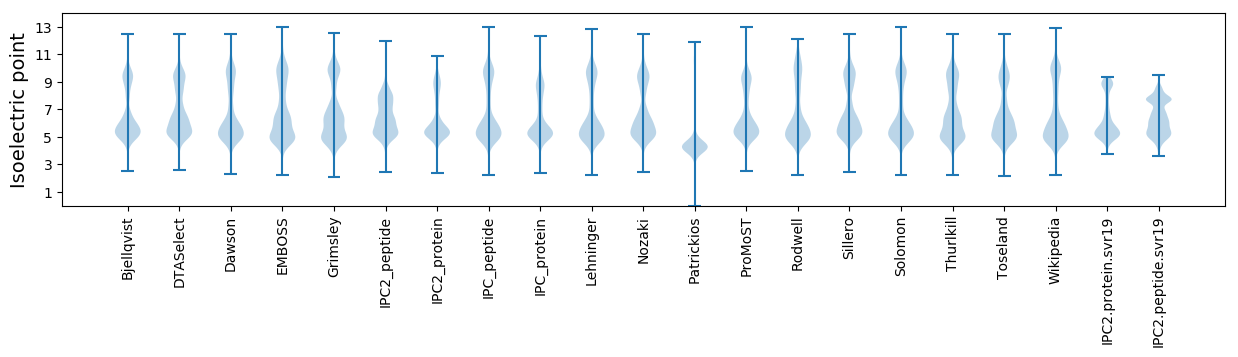
* You can choose from 21 different methods for calculating isoelectric point
Summary statistics related to proteome-wise predictions
Protein with the lowest isoelectric point:
>tr|A0A1I3RMG7|A0A1I3RMG7_9BACL Putative MFS transporter AGZA family xanthine/uracil permease OS=Brevibacillus centrosporus OX=54910 GN=SAMN05518846_103456 PE=3 SV=1
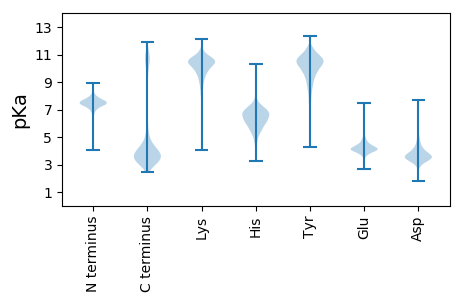
MM1 pKa = 7.47WLGGFSEE8 pKa = 4.72NVLEE12 pKa = 6.06DD13 pKa = 3.59FDD15 pKa = 4.12YY16 pKa = 10.98WEE18 pKa = 4.72SSTIDD23 pKa = 3.55TYY25 pKa = 11.98NLDD28 pKa = 4.68DD29 pKa = 3.63EE30 pKa = 4.77TANARR35 pKa = 11.84LVFEE39 pKa = 4.14NQVNNEE45 pKa = 3.84IGSDD49 pKa = 3.8FNFWRR54 pKa = 11.84VNSSGDD60 pKa = 3.24AEE62 pKa = 4.08LRR64 pKa = 11.84YY65 pKa = 9.63YY66 pKa = 11.06ANDD69 pKa = 3.74YY70 pKa = 9.6TDD72 pKa = 3.59DD73 pKa = 3.87WYY75 pKa = 11.29GLMTPYY81 pKa = 10.51KK82 pKa = 10.18INSSDD87 pKa = 3.57NYY89 pKa = 10.86VEE91 pKa = 4.33AQYY94 pKa = 11.59GDD96 pKa = 2.93QWDD99 pKa = 3.71RR100 pKa = 11.84AKK102 pKa = 10.61IQLNYY107 pKa = 10.78EE108 pKa = 4.04LMDD111 pKa = 4.28NDD113 pKa = 4.49GMTAANRR120 pKa = 11.84DD121 pKa = 3.27WTVLHH126 pKa = 5.79EE127 pKa = 4.44TGHH130 pKa = 5.48VFSLKK135 pKa = 10.44HH136 pKa = 5.71NPEE139 pKa = 4.46ADD141 pKa = 3.22SVMRR145 pKa = 11.84TVEE148 pKa = 3.84TSFWGNPIFFDD159 pKa = 3.71YY160 pKa = 11.53DD161 pKa = 3.31EE162 pKa = 4.54FTQLDD167 pKa = 4.93LDD169 pKa = 4.06NLDD172 pKa = 3.12YY173 pKa = 10.87RR174 pKa = 11.84YY175 pKa = 10.84
MM1 pKa = 7.47WLGGFSEE8 pKa = 4.72NVLEE12 pKa = 6.06DD13 pKa = 3.59FDD15 pKa = 4.12YY16 pKa = 10.98WEE18 pKa = 4.72SSTIDD23 pKa = 3.55TYY25 pKa = 11.98NLDD28 pKa = 4.68DD29 pKa = 3.63EE30 pKa = 4.77TANARR35 pKa = 11.84LVFEE39 pKa = 4.14NQVNNEE45 pKa = 3.84IGSDD49 pKa = 3.8FNFWRR54 pKa = 11.84VNSSGDD60 pKa = 3.24AEE62 pKa = 4.08LRR64 pKa = 11.84YY65 pKa = 9.63YY66 pKa = 11.06ANDD69 pKa = 3.74YY70 pKa = 9.6TDD72 pKa = 3.59DD73 pKa = 3.87WYY75 pKa = 11.29GLMTPYY81 pKa = 10.51KK82 pKa = 10.18INSSDD87 pKa = 3.57NYY89 pKa = 10.86VEE91 pKa = 4.33AQYY94 pKa = 11.59GDD96 pKa = 2.93QWDD99 pKa = 3.71RR100 pKa = 11.84AKK102 pKa = 10.61IQLNYY107 pKa = 10.78EE108 pKa = 4.04LMDD111 pKa = 4.28NDD113 pKa = 4.49GMTAANRR120 pKa = 11.84DD121 pKa = 3.27WTVLHH126 pKa = 5.79EE127 pKa = 4.44TGHH130 pKa = 5.48VFSLKK135 pKa = 10.44HH136 pKa = 5.71NPEE139 pKa = 4.46ADD141 pKa = 3.22SVMRR145 pKa = 11.84TVEE148 pKa = 3.84TSFWGNPIFFDD159 pKa = 3.71YY160 pKa = 11.53DD161 pKa = 3.31EE162 pKa = 4.54FTQLDD167 pKa = 4.93LDD169 pKa = 4.06NLDD172 pKa = 3.12YY173 pKa = 10.87RR174 pKa = 11.84YY175 pKa = 10.84
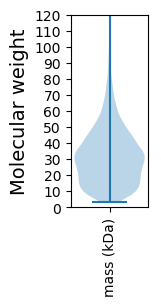
Molecular weight: 20.69 kDa
Isoelectric point according different methods:
Protein with the highest isoelectric point:
>tr|A0A1I3WPZ8|A0A1I3WPZ8_9BACL Cell shape-determining protein MreC OS=Brevibacillus centrosporus OX=54910 GN=SAMN05518846_108252 PE=3 SV=1
MM1 pKa = 7.18VVRR4 pKa = 11.84SLLRR8 pKa = 11.84VLATSGIVAIIGYY21 pKa = 10.13LMAPRR26 pKa = 11.84RR27 pKa = 11.84RR28 pKa = 11.84SRR30 pKa = 11.84FAFKK34 pKa = 9.74WNRR37 pKa = 11.84MPFSMRR43 pKa = 11.84DD44 pKa = 3.42MQRR47 pKa = 11.84MMKK50 pKa = 9.74TGRR53 pKa = 11.84KK54 pKa = 9.13LMRR57 pKa = 11.84AVARR61 pKa = 4.2
MM1 pKa = 7.18VVRR4 pKa = 11.84SLLRR8 pKa = 11.84VLATSGIVAIIGYY21 pKa = 10.13LMAPRR26 pKa = 11.84RR27 pKa = 11.84RR28 pKa = 11.84SRR30 pKa = 11.84FAFKK34 pKa = 9.74WNRR37 pKa = 11.84MPFSMRR43 pKa = 11.84DD44 pKa = 3.42MQRR47 pKa = 11.84MMKK50 pKa = 9.74TGRR53 pKa = 11.84KK54 pKa = 9.13LMRR57 pKa = 11.84AVARR61 pKa = 4.2
Molecular weight: 7.22 kDa
Isoelectric point according different methods:
Peptides (in silico digests for buttom-up proteomics)
Below you can find in silico digests of the whole proteome with Trypsin, Chymotrypsin, Trypsin+LysC, LysN, ArgC proteases suitable for different mass spec machines.| Try ESI |
 |
|---|
| ChTry ESI |
|
|---|
| ArgC ESI |
|
|---|
| LysN ESI |
|
|---|
| TryLysC ESI |
|
|---|
| Try MALDI |
|
|---|
| ChTry MALDI |
|
|---|
| ArgC MALDI |
|
|---|
| LysN MALDI |
|
|---|
| TryLysC MALDI |
|
|---|
| Try LTQ |
|
|---|
| ChTry LTQ |
|
|---|
| ArgC LTQ |
|
|---|
| LysN LTQ |
|
|---|
| TryLysC LTQ |
|
|---|
| Try MSlow |
|
|---|
| ChTry MSlow |
|
|---|
| ArgC MSlow |
|
|---|
| LysN MSlow |
|
|---|
| TryLysC MSlow |
|
|---|
| Try MShigh |
|
|---|
| ChTry MShigh |
|
|---|
| ArgC MShigh |
|
|---|
| LysN MShigh |
|
|---|
| TryLysC MShigh |
|
|---|
General Statistics
Number of major isoforms |
Number of additional isoforms |
Number of all proteins |
Number of amino acids |
Min. Seq. Length |
Max. Seq. Length |
Avg. Seq. Length |
Avg. Mol. Weight |
|---|---|---|---|---|---|---|---|
0 |
1701798 |
25 |
1997 |
297.0 |
33.06 |
Amino acid frequency
Ala |
Cys |
Asp |
Glu |
Phe |
Gly |
His |
Ile |
Lys |
Leu |
|---|---|---|---|---|---|---|---|---|---|
8.452 ± 0.036 | 0.794 ± 0.008 |
4.839 ± 0.026 | 6.973 ± 0.037 |
4.115 ± 0.026 | 7.358 ± 0.032 |
2.173 ± 0.015 | 6.588 ± 0.028 |
5.435 ± 0.032 | 10.243 ± 0.041 |
Met |
Asn |
Gln |
Pro |
Arg |
Ser |
Thr |
Val |
Trp |
Tyr |
|---|---|---|---|---|---|---|---|---|---|
2.917 ± 0.013 | 3.337 ± 0.019 |
4.138 ± 0.024 | 4.227 ± 0.024 |
5.05 ± 0.026 | 5.978 ± 0.023 |
5.436 ± 0.023 | 7.571 ± 0.025 |
1.201 ± 0.014 | 3.174 ± 0.02 |
Most of the basic statistics you can see at this page can be downloaded from this CSV file
See this proteome in:

Proteome-pI is available under Creative Commons Attribution-NoDerivs license, for more details see here
| Reference: Kozlowski LP. Proteome-pI 2.0: Proteome Isoelectric Point Database Update. Nucleic Acids Res. 2021, doi: 10.1093/nar/gkab944 | Contact: Lukasz P. Kozlowski |