Prauserella muralis
Taxonomy: cellular organisms; Bacteria; Terrabacteria group; Actinobacteria; Actinomycetia; Pseudonocardiales; Pseudonocardiaceae; Prauserella
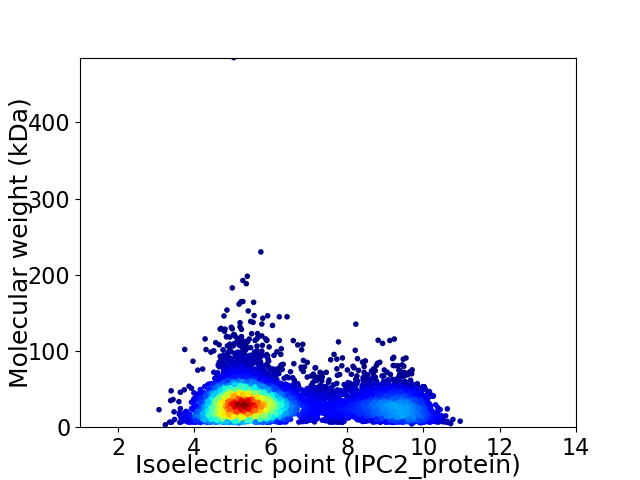
Average proteome isoelectric point is 6.3
Get precalculated fractions of proteins

Virtual 2D-PAGE plot for 7018 proteins (isoelectric point calculated using IPC2_protein)
Get csv file with sequences according to given criteria:
* You can choose from 21 different methods for calculating isoelectric point
Summary statistics related to proteome-wise predictions


Protein with the lowest isoelectric point:
>tr|A0A2V4AM13|A0A2V4AM13_9PSEU Uncharacterized protein OS=Prauserella muralis OX=588067 GN=BAY60_28255 PE=3 SV=1
MM1 pKa = 7.33PAKK4 pKa = 10.59DD5 pKa = 3.4EE6 pKa = 5.04GIAMTYY12 pKa = 9.66PPQPGQQPGWNGYY25 pKa = 9.13GGQPPQGGCPQGYY38 pKa = 6.89QQHH41 pKa = 6.62GGHH44 pKa = 6.73PHH46 pKa = 5.51QGGYY50 pKa = 9.22PPPGQVPPYY59 pKa = 9.87GYY61 pKa = 9.17PQGGGGWGGPPPPKK75 pKa = 10.25SRR77 pKa = 11.84AGLWAGLGAGALAVVAFVITAFVAPGFLLGDD108 pKa = 4.18DD109 pKa = 4.56SGDD112 pKa = 3.66PPGGAGAQAGGQGGGNSAEE131 pKa = 4.4AFAQGIVAAFNNSDD145 pKa = 3.82TNTLNAAMCPGAEE158 pKa = 4.0PDD160 pKa = 3.34VSEE163 pKa = 5.07VIGQASVVEE172 pKa = 4.02NMKK175 pKa = 10.65LGAVKK180 pKa = 10.37SVSDD184 pKa = 3.75TEE186 pKa = 4.17ATAEE190 pKa = 4.14VSLTAAGSPMTAVAALKK207 pKa = 10.89NEE209 pKa = 4.02GGNWCWDD216 pKa = 4.07GITMGSAGSSPSVGASEE233 pKa = 4.87SSSAPAPGTGGGDD246 pKa = 3.4PDD248 pKa = 3.85GVVSRR253 pKa = 11.84FVEE256 pKa = 4.32AVNNGDD262 pKa = 3.5KK263 pKa = 10.49NAAMSLVCPDD273 pKa = 3.15QEE275 pKa = 4.61YY276 pKa = 8.39TVGTDD281 pKa = 2.94VEE283 pKa = 4.33RR284 pKa = 11.84AIGDD288 pKa = 4.0SAKK291 pKa = 9.66LTAGPAEE298 pKa = 4.18QDD300 pKa = 3.17GSVYY304 pKa = 9.19TAEE307 pKa = 4.24VTGTDD312 pKa = 2.98DD313 pKa = 4.03DD314 pKa = 4.36GRR316 pKa = 11.84VEE318 pKa = 4.22GAVGVSDD325 pKa = 4.43DD326 pKa = 3.86GCVIGLVLFF335 pKa = 4.81
MM1 pKa = 7.33PAKK4 pKa = 10.59DD5 pKa = 3.4EE6 pKa = 5.04GIAMTYY12 pKa = 9.66PPQPGQQPGWNGYY25 pKa = 9.13GGQPPQGGCPQGYY38 pKa = 6.89QQHH41 pKa = 6.62GGHH44 pKa = 6.73PHH46 pKa = 5.51QGGYY50 pKa = 9.22PPPGQVPPYY59 pKa = 9.87GYY61 pKa = 9.17PQGGGGWGGPPPPKK75 pKa = 10.25SRR77 pKa = 11.84AGLWAGLGAGALAVVAFVITAFVAPGFLLGDD108 pKa = 4.18DD109 pKa = 4.56SGDD112 pKa = 3.66PPGGAGAQAGGQGGGNSAEE131 pKa = 4.4AFAQGIVAAFNNSDD145 pKa = 3.82TNTLNAAMCPGAEE158 pKa = 4.0PDD160 pKa = 3.34VSEE163 pKa = 5.07VIGQASVVEE172 pKa = 4.02NMKK175 pKa = 10.65LGAVKK180 pKa = 10.37SVSDD184 pKa = 3.75TEE186 pKa = 4.17ATAEE190 pKa = 4.14VSLTAAGSPMTAVAALKK207 pKa = 10.89NEE209 pKa = 4.02GGNWCWDD216 pKa = 4.07GITMGSAGSSPSVGASEE233 pKa = 4.87SSSAPAPGTGGGDD246 pKa = 3.4PDD248 pKa = 3.85GVVSRR253 pKa = 11.84FVEE256 pKa = 4.32AVNNGDD262 pKa = 3.5KK263 pKa = 10.49NAAMSLVCPDD273 pKa = 3.15QEE275 pKa = 4.61YY276 pKa = 8.39TVGTDD281 pKa = 2.94VEE283 pKa = 4.33RR284 pKa = 11.84AIGDD288 pKa = 4.0SAKK291 pKa = 9.66LTAGPAEE298 pKa = 4.18QDD300 pKa = 3.17GSVYY304 pKa = 9.19TAEE307 pKa = 4.24VTGTDD312 pKa = 2.98DD313 pKa = 4.03DD314 pKa = 4.36GRR316 pKa = 11.84VEE318 pKa = 4.22GAVGVSDD325 pKa = 4.43DD326 pKa = 3.86GCVIGLVLFF335 pKa = 4.81
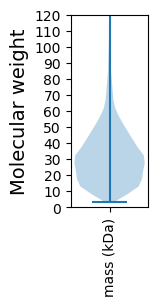
Molecular weight: 32.86 kDa
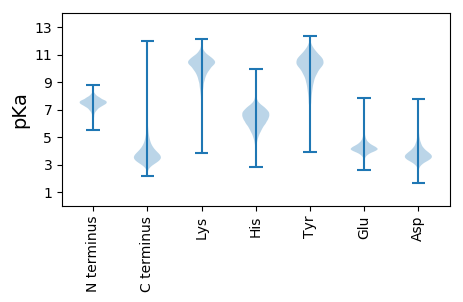
Isoelectric point according different methods:
Protein with the highest isoelectric point:
>tr|A0A2V4ADL0|A0A2V4ADL0_9PSEU FAD-dependent oxidoreductase OS=Prauserella muralis OX=588067 GN=BAY60_34510 PE=4 SV=1
MM1 pKa = 6.49STVRR5 pKa = 11.84FRR7 pKa = 11.84WRR9 pKa = 11.84KK10 pKa = 4.76TLRR13 pKa = 11.84WGPIRR18 pKa = 11.84LNTHH22 pKa = 6.06NGRR25 pKa = 11.84ATSWSFTLGRR35 pKa = 11.84LSWNSRR41 pKa = 11.84TGWHH45 pKa = 7.22LDD47 pKa = 3.37TPGPGSVHH55 pKa = 6.41IGHH58 pKa = 7.92PGRR61 pKa = 11.84TRR63 pKa = 11.84PRR65 pKa = 11.84RR66 pKa = 11.84RR67 pKa = 3.13
MM1 pKa = 6.49STVRR5 pKa = 11.84FRR7 pKa = 11.84WRR9 pKa = 11.84KK10 pKa = 4.76TLRR13 pKa = 11.84WGPIRR18 pKa = 11.84LNTHH22 pKa = 6.06NGRR25 pKa = 11.84ATSWSFTLGRR35 pKa = 11.84LSWNSRR41 pKa = 11.84TGWHH45 pKa = 7.22LDD47 pKa = 3.37TPGPGSVHH55 pKa = 6.41IGHH58 pKa = 7.92PGRR61 pKa = 11.84TRR63 pKa = 11.84PRR65 pKa = 11.84RR66 pKa = 11.84RR67 pKa = 3.13
Molecular weight: 7.87 kDa
Isoelectric point according different methods:
Peptides (in silico digests for buttom-up proteomics)
Below you can find in silico digests of the whole proteome with Trypsin, Chymotrypsin, Trypsin+LysC, LysN, ArgC proteases suitable for different mass spec machines.| Try ESI |
 |
|---|
| ChTry ESI |
 |
|---|
| ArgC ESI |
 |
|---|
| LysN ESI |
 |
|---|
| TryLysC ESI |
 |
|---|
| Try MALDI |
 |
|---|
| ChTry MALDI |
 |
|---|
| ArgC MALDI |
 |
|---|
| LysN MALDI |
 |
|---|
| TryLysC MALDI |
 |
|---|
| Try LTQ |
 |
|---|
| ChTry LTQ |
 |
|---|
| ArgC LTQ |
 |
|---|
| LysN LTQ |
 |
|---|
| TryLysC LTQ |
 |
|---|
| Try MSlow |
 |
|---|
| ChTry MSlow |
 |
|---|
| ArgC MSlow |
 |
|---|
| LysN MSlow |
 |
|---|
| TryLysC MSlow |
 |
|---|
| Try MShigh |
 |
|---|
| ChTry MShigh |
 |
|---|
| ArgC MShigh |
 |
|---|
| LysN MShigh |
 |
|---|
| TryLysC MShigh |
 |
|---|
General Statistics
Number of major isoforms |
Number of additional isoforms |
Number of all proteins |
Number of amino acids |
Min. Seq. Length |
Max. Seq. Length |
Avg. Seq. Length |
Avg. Mol. Weight |
|---|---|---|---|---|---|---|---|
0 |
2183359 |
29 |
4480 |
311.1 |
33.34 |
Amino acid frequency
Ala |
Cys |
Asp |
Glu |
Phe |
Gly |
His |
Ile |
Lys |
Leu |
|---|---|---|---|---|---|---|---|---|---|
13.622 ± 0.048 | 0.784 ± 0.008 |
5.909 ± 0.023 | 5.853 ± 0.028 |
2.792 ± 0.015 | 9.41 ± 0.028 |
2.281 ± 0.015 | 3.301 ± 0.018 |
1.758 ± 0.02 | 10.675 ± 0.037 |
Met |
Asn |
Gln |
Pro |
Arg |
Ser |
Thr |
Val |
Trp |
Tyr |
|---|---|---|---|---|---|---|---|---|---|
1.686 ± 0.011 | 1.738 ± 0.013 |
5.915 ± 0.026 | 2.775 ± 0.014 |
8.334 ± 0.031 | 4.843 ± 0.022 |
5.905 ± 0.018 | 8.93 ± 0.021 |
1.496 ± 0.012 | 1.992 ± 0.013 |
Most of the basic statistics you can see at this page can be downloaded from this CSV file
Proteome-pI is available under Creative Commons Attribution-NoDerivs license, for more details see here
| Reference: Kozlowski LP. Proteome-pI 2.0: Proteome Isoelectric Point Database Update. Nucleic Acids Res. 2021, doi: 10.1093/nar/gkab944 | Contact: Lukasz P. Kozlowski |
