Arthrobacter crystallopoietes
Taxonomy: cellular organisms; Bacteria; Terrabacteria group; Actinobacteria; Actinomycetia; Micrococcales; Micrococcaceae; Arthrobacter
Average proteome isoelectric point is 6.04
Get precalculated fractions of proteins

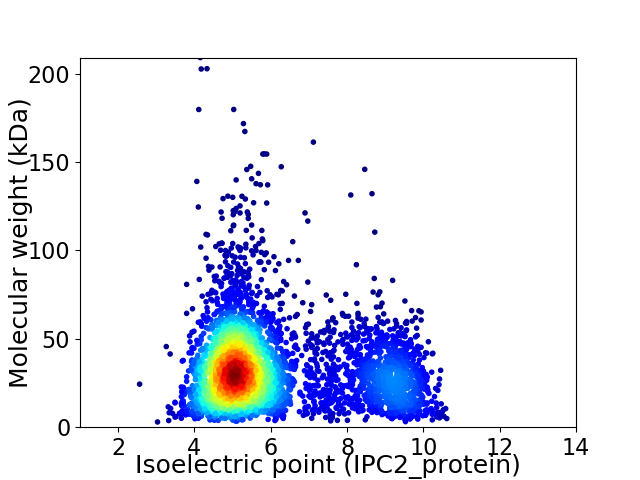
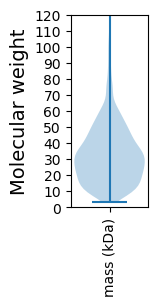
Virtual 2D-PAGE plot for 4622 proteins (isoelectric point calculated using IPC2_protein)
Get csv file with sequences according to given criteria:
* You can choose from 21 different methods for calculating isoelectric point
Summary statistics related to proteome-wise predictions


Protein with the lowest isoelectric point:
>tr|A0A1H1EZC7|A0A1H1EZC7_9MICC 3-oxoadipate enol-lactonase OS=Arthrobacter crystallopoietes OX=37928 GN=SAMN04489742_3168 PE=4 SV=1
MM1 pKa = 7.35RR2 pKa = 11.84TNASTVVKK10 pKa = 9.89VFSVLATGTLALTACGGGSSTDD32 pKa = 3.48GGSPAADD39 pKa = 3.41GNEE42 pKa = 4.19LGLVTPGTLTVCSDD56 pKa = 2.76IPYY59 pKa = 9.82PPFEE63 pKa = 4.11FEE65 pKa = 4.57EE66 pKa = 4.34NGEE69 pKa = 4.1YY70 pKa = 9.8TGYY73 pKa = 11.36DD74 pKa = 2.87MDD76 pKa = 5.96LIRR79 pKa = 11.84EE80 pKa = 4.19IATGMGLEE88 pKa = 4.18TQIQDD93 pKa = 3.45VGFDD97 pKa = 3.59ALQSGVVLASGQCDD111 pKa = 2.83IGASAMTITEE121 pKa = 4.03EE122 pKa = 4.73RR123 pKa = 11.84EE124 pKa = 3.8EE125 pKa = 4.04NLDD128 pKa = 3.54FSEE131 pKa = 5.13PYY133 pKa = 10.14YY134 pKa = 11.08DD135 pKa = 4.06SLQSLLVPADD145 pKa = 3.75SDD147 pKa = 3.38IKK149 pKa = 11.16AIGDD153 pKa = 3.74LAGKK157 pKa = 9.84SVGVQQGTTGEE168 pKa = 4.17AYY170 pKa = 9.32TRR172 pKa = 11.84EE173 pKa = 4.12NVPADD178 pKa = 3.84TEE180 pKa = 4.23VRR182 pKa = 11.84AYY184 pKa = 9.91PSDD187 pKa = 4.28AEE189 pKa = 4.7LFPALQSGGVDD200 pKa = 3.88AVLQDD205 pKa = 3.72LPVNLGHH212 pKa = 7.63LEE214 pKa = 4.03GGKK217 pKa = 9.79YY218 pKa = 9.97EE219 pKa = 4.17IVEE222 pKa = 4.43EE223 pKa = 4.45YY224 pKa = 8.39PTDD227 pKa = 3.48EE228 pKa = 4.48SYY230 pKa = 11.73GFAVKK235 pKa = 10.65EE236 pKa = 4.13EE237 pKa = 4.28GSEE240 pKa = 4.08ALLEE244 pKa = 4.23AVNAEE249 pKa = 4.09LAEE252 pKa = 4.23LRR254 pKa = 11.84DD255 pKa = 3.5SGKK258 pKa = 10.07YY259 pKa = 7.88QEE261 pKa = 5.62IYY263 pKa = 10.83DD264 pKa = 4.37KK265 pKa = 11.54YY266 pKa = 9.33FTQQ269 pKa = 4.4
MM1 pKa = 7.35RR2 pKa = 11.84TNASTVVKK10 pKa = 9.89VFSVLATGTLALTACGGGSSTDD32 pKa = 3.48GGSPAADD39 pKa = 3.41GNEE42 pKa = 4.19LGLVTPGTLTVCSDD56 pKa = 2.76IPYY59 pKa = 9.82PPFEE63 pKa = 4.11FEE65 pKa = 4.57EE66 pKa = 4.34NGEE69 pKa = 4.1YY70 pKa = 9.8TGYY73 pKa = 11.36DD74 pKa = 2.87MDD76 pKa = 5.96LIRR79 pKa = 11.84EE80 pKa = 4.19IATGMGLEE88 pKa = 4.18TQIQDD93 pKa = 3.45VGFDD97 pKa = 3.59ALQSGVVLASGQCDD111 pKa = 2.83IGASAMTITEE121 pKa = 4.03EE122 pKa = 4.73RR123 pKa = 11.84EE124 pKa = 3.8EE125 pKa = 4.04NLDD128 pKa = 3.54FSEE131 pKa = 5.13PYY133 pKa = 10.14YY134 pKa = 11.08DD135 pKa = 4.06SLQSLLVPADD145 pKa = 3.75SDD147 pKa = 3.38IKK149 pKa = 11.16AIGDD153 pKa = 3.74LAGKK157 pKa = 9.84SVGVQQGTTGEE168 pKa = 4.17AYY170 pKa = 9.32TRR172 pKa = 11.84EE173 pKa = 4.12NVPADD178 pKa = 3.84TEE180 pKa = 4.23VRR182 pKa = 11.84AYY184 pKa = 9.91PSDD187 pKa = 4.28AEE189 pKa = 4.7LFPALQSGGVDD200 pKa = 3.88AVLQDD205 pKa = 3.72LPVNLGHH212 pKa = 7.63LEE214 pKa = 4.03GGKK217 pKa = 9.79YY218 pKa = 9.97EE219 pKa = 4.17IVEE222 pKa = 4.43EE223 pKa = 4.45YY224 pKa = 8.39PTDD227 pKa = 3.48EE228 pKa = 4.48SYY230 pKa = 11.73GFAVKK235 pKa = 10.65EE236 pKa = 4.13EE237 pKa = 4.28GSEE240 pKa = 4.08ALLEE244 pKa = 4.23AVNAEE249 pKa = 4.09LAEE252 pKa = 4.23LRR254 pKa = 11.84DD255 pKa = 3.5SGKK258 pKa = 10.07YY259 pKa = 7.88QEE261 pKa = 5.62IYY263 pKa = 10.83DD264 pKa = 4.37KK265 pKa = 11.54YY266 pKa = 9.33FTQQ269 pKa = 4.4
Molecular weight: 28.52 kDa
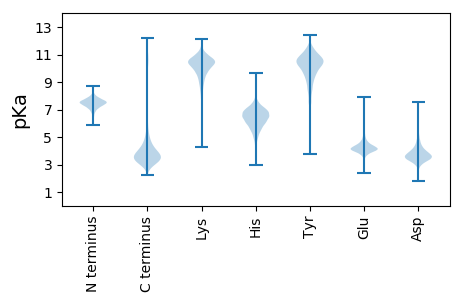
Isoelectric point according different methods:
Protein with the highest isoelectric point:
>tr|A0A1H1BMJ5|A0A1H1BMJ5_9MICC DNA-binding transcriptional regulator IclR family OS=Arthrobacter crystallopoietes OX=37928 GN=SAMN04489742_1483 PE=4 SV=1
MM1 pKa = 7.41HH2 pKa = 7.02SAATSRR8 pKa = 11.84LAPVRR13 pKa = 11.84LLRR16 pKa = 11.84AAAVSATVLSLAAAAHH32 pKa = 5.24VAGGGTMPAAGVVIGLSVLTLLPVTLLAGRR62 pKa = 11.84KK63 pKa = 9.06LGPTTMAAILAVSQLALHH81 pKa = 5.8QAFTVLSTTAVCTEE95 pKa = 4.5AGHH98 pKa = 6.2HH99 pKa = 6.59AYY101 pKa = 10.22AGAGSLEE108 pKa = 4.4CVATAAGAAGAAVHH122 pKa = 6.7GPAEE126 pKa = 4.38HH127 pKa = 6.33GAAMVVAHH135 pKa = 6.24VLAAALTGLLLVRR148 pKa = 11.84GEE150 pKa = 4.01EE151 pKa = 4.33AVWALAAWLRR161 pKa = 11.84PLAKK165 pKa = 10.26LPSAVVLPILPRR177 pKa = 11.84PAMPPGGALLRR188 pKa = 11.84PRR190 pKa = 11.84TLCQLKK196 pKa = 10.5LEE198 pKa = 4.61PLRR201 pKa = 11.84GPPALSFHH209 pKa = 6.83
MM1 pKa = 7.41HH2 pKa = 7.02SAATSRR8 pKa = 11.84LAPVRR13 pKa = 11.84LLRR16 pKa = 11.84AAAVSATVLSLAAAAHH32 pKa = 5.24VAGGGTMPAAGVVIGLSVLTLLPVTLLAGRR62 pKa = 11.84KK63 pKa = 9.06LGPTTMAAILAVSQLALHH81 pKa = 5.8QAFTVLSTTAVCTEE95 pKa = 4.5AGHH98 pKa = 6.2HH99 pKa = 6.59AYY101 pKa = 10.22AGAGSLEE108 pKa = 4.4CVATAAGAAGAAVHH122 pKa = 6.7GPAEE126 pKa = 4.38HH127 pKa = 6.33GAAMVVAHH135 pKa = 6.24VLAAALTGLLLVRR148 pKa = 11.84GEE150 pKa = 4.01EE151 pKa = 4.33AVWALAAWLRR161 pKa = 11.84PLAKK165 pKa = 10.26LPSAVVLPILPRR177 pKa = 11.84PAMPPGGALLRR188 pKa = 11.84PRR190 pKa = 11.84TLCQLKK196 pKa = 10.5LEE198 pKa = 4.61PLRR201 pKa = 11.84GPPALSFHH209 pKa = 6.83
Molecular weight: 20.77 kDa
Isoelectric point according different methods:
Peptides (in silico digests for buttom-up proteomics)
Below you can find in silico digests of the whole proteome with Trypsin, Chymotrypsin, Trypsin+LysC, LysN, ArgC proteases suitable for different mass spec machines.| Try ESI |
 |
|---|
| ChTry ESI |
 |
|---|
| ArgC ESI |
 |
|---|
| LysN ESI |
 |
|---|
| TryLysC ESI |
 |
|---|
| Try MALDI |
 |
|---|
| ChTry MALDI |
 |
|---|
| ArgC MALDI |
 |
|---|
| LysN MALDI |
 |
|---|
| TryLysC MALDI |
 |
|---|
| Try LTQ |
 |
|---|
| ChTry LTQ |
 |
|---|
| ArgC LTQ |
 |
|---|
| LysN LTQ |
 |
|---|
| TryLysC LTQ |
 |
|---|
| Try MSlow |
 |
|---|
| ChTry MSlow |
 |
|---|
| ArgC MSlow |
 |
|---|
| LysN MSlow |
 |
|---|
| TryLysC MSlow |
 |
|---|
| Try MShigh |
 |
|---|
| ChTry MShigh |
 |
|---|
| ArgC MShigh |
 |
|---|
| LysN MShigh |
 |
|---|
| TryLysC MShigh |
 |
|---|
General Statistics
Number of major isoforms |
Number of additional isoforms |
Number of all proteins |
Number of amino acids |
Min. Seq. Length |
Max. Seq. Length |
Avg. Seq. Length |
Avg. Mol. Weight |
|---|---|---|---|---|---|---|---|
0 |
1477220 |
30 |
2027 |
319.6 |
34.34 |
Amino acid frequency
Ala |
Cys |
Asp |
Glu |
Phe |
Gly |
His |
Ile |
Lys |
Leu |
|---|---|---|---|---|---|---|---|---|---|
12.667 ± 0.055 | 0.672 ± 0.01 |
5.625 ± 0.025 | 6.115 ± 0.039 |
3.187 ± 0.023 | 8.966 ± 0.032 |
2.076 ± 0.016 | 4.537 ± 0.026 |
2.785 ± 0.024 | 10.252 ± 0.041 |
Met |
Asn |
Gln |
Pro |
Arg |
Ser |
Thr |
Val |
Trp |
Tyr |
|---|---|---|---|---|---|---|---|---|---|
2.108 ± 0.015 | 2.532 ± 0.019 |
5.425 ± 0.024 | 3.296 ± 0.021 |
6.492 ± 0.032 | 5.788 ± 0.022 |
5.783 ± 0.025 | 8.13 ± 0.03 |
1.424 ± 0.013 | 2.14 ± 0.017 |
Most of the basic statistics you can see at this page can be downloaded from this CSV file
Proteome-pI is available under Creative Commons Attribution-NoDerivs license, for more details see here
| Reference: Kozlowski LP. Proteome-pI 2.0: Proteome Isoelectric Point Database Update. Nucleic Acids Res. 2021, doi: 10.1093/nar/gkab944 | Contact: Lukasz P. Kozlowski |
