Bhargavaea cecembensis DSE10
Taxonomy: cellular organisms; Bacteria; Terrabacteria group; Firmicutes; Bacilli; Bacillales; Planococcaceae; Bhargavaea; Bhargavaea cecembensis
Average proteome isoelectric point is 6.0
Get precalculated fractions of proteins

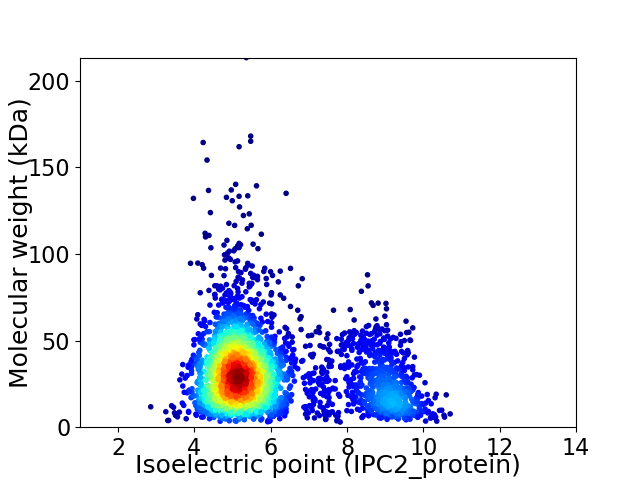
Virtual 2D-PAGE plot for 3168 proteins (isoelectric point calculated using IPC2_protein)
Get csv file with sequences according to given criteria:
* You can choose from 21 different methods for calculating isoelectric point
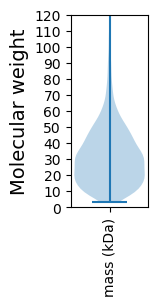
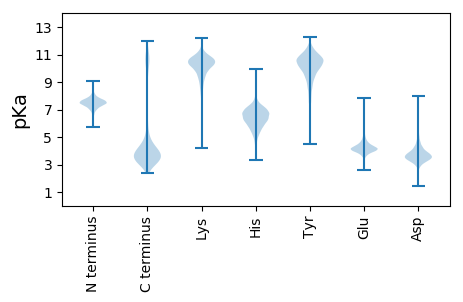
Summary statistics related to proteome-wise predictions


Protein with the lowest isoelectric point:
>tr|M7NDL7|M7NDL7_9BACL Rhodanese domain-containing protein OS=Bhargavaea cecembensis DSE10 OX=1235279 GN=C772_01191 PE=4 SV=1
MM1 pKa = 7.93RR2 pKa = 11.84KK3 pKa = 9.69GLLVTLVALLCGAILIFSYY22 pKa = 9.38LTYY25 pKa = 10.62QNRR28 pKa = 11.84LEE30 pKa = 3.82EE31 pKa = 4.17AARR34 pKa = 11.84VKK36 pKa = 10.04TDD38 pKa = 3.09EE39 pKa = 4.18EE40 pKa = 5.14TVTNEE45 pKa = 3.82PEE47 pKa = 4.07EE48 pKa = 4.36NTTSEE53 pKa = 4.22PEE55 pKa = 3.94QNGEE59 pKa = 4.16EE60 pKa = 4.24NTDD63 pKa = 3.5SVSIKK68 pKa = 9.95QEE70 pKa = 3.73EE71 pKa = 4.37LEE73 pKa = 4.11ILSANTDD80 pKa = 3.06AKK82 pKa = 10.07VQEE85 pKa = 4.23VLLARR90 pKa = 11.84LEE92 pKa = 4.43AGEE95 pKa = 4.07PAQMVVIGSGEE106 pKa = 3.79IQGIADD112 pKa = 4.36RR113 pKa = 11.84LADD116 pKa = 4.26AVNEE120 pKa = 4.19AYY122 pKa = 10.52GDD124 pKa = 3.97FLTVDD129 pKa = 3.85AFAFDD134 pKa = 3.59GTSAEE139 pKa = 4.32FVEE142 pKa = 4.73QGVPNLAWTNEE153 pKa = 3.83YY154 pKa = 10.87DD155 pKa = 3.31IVLYY159 pKa = 10.7EE160 pKa = 4.76PFTLNNNGIVVIEE173 pKa = 4.93DD174 pKa = 3.32EE175 pKa = 4.61HH176 pKa = 8.03AHH178 pKa = 5.75IAQVEE183 pKa = 4.29EE184 pKa = 4.16RR185 pKa = 11.84AMEE188 pKa = 4.22AVQDD192 pKa = 3.99SAFLITPSHH201 pKa = 6.84PIEE204 pKa = 4.14NAGYY208 pKa = 9.81YY209 pKa = 7.97LTQIDD214 pKa = 4.01SLKK217 pKa = 11.03NYY219 pKa = 10.25AEE221 pKa = 4.18QQGIPYY227 pKa = 9.92VDD229 pKa = 3.57TWNNWPMDD237 pKa = 4.04EE238 pKa = 4.51LDD240 pKa = 4.83SYY242 pKa = 11.58LDD244 pKa = 3.69EE245 pKa = 5.53NGVPTEE251 pKa = 3.88QGLDD255 pKa = 3.17VWADD259 pKa = 3.26ALIQYY264 pKa = 8.1FIAQQ268 pKa = 3.44
MM1 pKa = 7.93RR2 pKa = 11.84KK3 pKa = 9.69GLLVTLVALLCGAILIFSYY22 pKa = 9.38LTYY25 pKa = 10.62QNRR28 pKa = 11.84LEE30 pKa = 3.82EE31 pKa = 4.17AARR34 pKa = 11.84VKK36 pKa = 10.04TDD38 pKa = 3.09EE39 pKa = 4.18EE40 pKa = 5.14TVTNEE45 pKa = 3.82PEE47 pKa = 4.07EE48 pKa = 4.36NTTSEE53 pKa = 4.22PEE55 pKa = 3.94QNGEE59 pKa = 4.16EE60 pKa = 4.24NTDD63 pKa = 3.5SVSIKK68 pKa = 9.95QEE70 pKa = 3.73EE71 pKa = 4.37LEE73 pKa = 4.11ILSANTDD80 pKa = 3.06AKK82 pKa = 10.07VQEE85 pKa = 4.23VLLARR90 pKa = 11.84LEE92 pKa = 4.43AGEE95 pKa = 4.07PAQMVVIGSGEE106 pKa = 3.79IQGIADD112 pKa = 4.36RR113 pKa = 11.84LADD116 pKa = 4.26AVNEE120 pKa = 4.19AYY122 pKa = 10.52GDD124 pKa = 3.97FLTVDD129 pKa = 3.85AFAFDD134 pKa = 3.59GTSAEE139 pKa = 4.32FVEE142 pKa = 4.73QGVPNLAWTNEE153 pKa = 3.83YY154 pKa = 10.87DD155 pKa = 3.31IVLYY159 pKa = 10.7EE160 pKa = 4.76PFTLNNNGIVVIEE173 pKa = 4.93DD174 pKa = 3.32EE175 pKa = 4.61HH176 pKa = 8.03AHH178 pKa = 5.75IAQVEE183 pKa = 4.29EE184 pKa = 4.16RR185 pKa = 11.84AMEE188 pKa = 4.22AVQDD192 pKa = 3.99SAFLITPSHH201 pKa = 6.84PIEE204 pKa = 4.14NAGYY208 pKa = 9.81YY209 pKa = 7.97LTQIDD214 pKa = 4.01SLKK217 pKa = 11.03NYY219 pKa = 10.25AEE221 pKa = 4.18QQGIPYY227 pKa = 9.92VDD229 pKa = 3.57TWNNWPMDD237 pKa = 4.04EE238 pKa = 4.51LDD240 pKa = 4.83SYY242 pKa = 11.58LDD244 pKa = 3.69EE245 pKa = 5.53NGVPTEE251 pKa = 3.88QGLDD255 pKa = 3.17VWADD259 pKa = 3.26ALIQYY264 pKa = 8.1FIAQQ268 pKa = 3.44
Molecular weight: 29.8 kDa
Isoelectric point according different methods:
Protein with the highest isoelectric point:
>tr|M7NCQ3|M7NCQ3_9BACL Spore cortex biosynthesis protein YabQ OS=Bhargavaea cecembensis DSE10 OX=1235279 GN=C772_02969 PE=4 SV=1
MM1 pKa = 6.76NQRR4 pKa = 11.84RR5 pKa = 11.84LIEE8 pKa = 4.12EE9 pKa = 3.58LWGRR13 pKa = 11.84EE14 pKa = 4.02KK15 pKa = 11.02YY16 pKa = 10.06RR17 pKa = 11.84VMYY20 pKa = 10.2HH21 pKa = 6.23SRR23 pKa = 11.84AHH25 pKa = 7.28DD26 pKa = 3.42DD27 pKa = 4.23RR28 pKa = 11.84IRR30 pKa = 11.84KK31 pKa = 6.45TLKK34 pKa = 10.35ADD36 pKa = 4.02PSPADD41 pKa = 2.98IEE43 pKa = 4.43TRR45 pKa = 11.84SGKK48 pKa = 10.15RR49 pKa = 11.84SGSRR53 pKa = 11.84PTPVRR58 pKa = 11.84QNFCFWSASS67 pKa = 3.39
MM1 pKa = 6.76NQRR4 pKa = 11.84RR5 pKa = 11.84LIEE8 pKa = 4.12EE9 pKa = 3.58LWGRR13 pKa = 11.84EE14 pKa = 4.02KK15 pKa = 11.02YY16 pKa = 10.06RR17 pKa = 11.84VMYY20 pKa = 10.2HH21 pKa = 6.23SRR23 pKa = 11.84AHH25 pKa = 7.28DD26 pKa = 3.42DD27 pKa = 4.23RR28 pKa = 11.84IRR30 pKa = 11.84KK31 pKa = 6.45TLKK34 pKa = 10.35ADD36 pKa = 4.02PSPADD41 pKa = 2.98IEE43 pKa = 4.43TRR45 pKa = 11.84SGKK48 pKa = 10.15RR49 pKa = 11.84SGSRR53 pKa = 11.84PTPVRR58 pKa = 11.84QNFCFWSASS67 pKa = 3.39
Molecular weight: 7.98 kDa
Isoelectric point according different methods:
Peptides (in silico digests for buttom-up proteomics)
Below you can find in silico digests of the whole proteome with Trypsin, Chymotrypsin, Trypsin+LysC, LysN, ArgC proteases suitable for different mass spec machines.| Try ESI |
 |
|---|
| ChTry ESI |
 |
|---|
| ArgC ESI |
 |
|---|
| LysN ESI |
 |
|---|
| TryLysC ESI |
 |
|---|
| Try MALDI |
 |
|---|
| ChTry MALDI |
 |
|---|
| ArgC MALDI |
 |
|---|
| LysN MALDI |
 |
|---|
| TryLysC MALDI |
 |
|---|
| Try LTQ |
 |
|---|
| ChTry LTQ |
 |
|---|
| ArgC LTQ |
 |
|---|
| LysN LTQ |
 |
|---|
| TryLysC LTQ |
 |
|---|
| Try MSlow |
 |
|---|
| ChTry MSlow |
 |
|---|
| ArgC MSlow |
 |
|---|
| LysN MSlow |
 |
|---|
| TryLysC MSlow |
 |
|---|
| Try MShigh |
 |
|---|
| ChTry MShigh |
 |
|---|
| ArgC MShigh |
 |
|---|
| LysN MShigh |
 |
|---|
| TryLysC MShigh |
 |
|---|
General Statistics
Number of major isoforms |
Number of additional isoforms |
Number of all proteins |
Number of amino acids |
Min. Seq. Length |
Max. Seq. Length |
Avg. Seq. Length |
Avg. Mol. Weight |
|---|---|---|---|---|---|---|---|
0 |
941780 |
30 |
1916 |
297.3 |
32.91 |
Amino acid frequency
Ala |
Cys |
Asp |
Glu |
Phe |
Gly |
His |
Ile |
Lys |
Leu |
|---|---|---|---|---|---|---|---|---|---|
8.866 ± 0.045 | 0.584 ± 0.014 |
5.577 ± 0.044 | 7.864 ± 0.056 |
4.301 ± 0.035 | 8.297 ± 0.039 |
2.031 ± 0.023 | 6.618 ± 0.04 |
5.1 ± 0.038 | 9.619 ± 0.051 |
Met |
Asn |
Gln |
Pro |
Arg |
Ser |
Thr |
Val |
Trp |
Tyr |
|---|---|---|---|---|---|---|---|---|---|
2.905 ± 0.021 | 3.241 ± 0.026 |
4.214 ± 0.026 | 3.051 ± 0.026 |
5.468 ± 0.046 | 5.545 ± 0.025 |
5.359 ± 0.029 | 7.282 ± 0.037 |
1.03 ± 0.017 | 3.048 ± 0.024 |
Most of the basic statistics you can see at this page can be downloaded from this CSV file
Proteome-pI is available under Creative Commons Attribution-NoDerivs license, for more details see here
| Reference: Kozlowski LP. Proteome-pI 2.0: Proteome Isoelectric Point Database Update. Nucleic Acids Res. 2021, doi: 10.1093/nar/gkab944 | Contact: Lukasz P. Kozlowski |
