Capybara microvirus Cap3_SP_539
Taxonomy: Viruses; Monodnaviria; Sangervirae; Phixviricota; Malgrandaviricetes; Petitvirales; Microviridae; unclassified Microviridae
Average proteome isoelectric point is 5.82
Get precalculated fractions of proteins

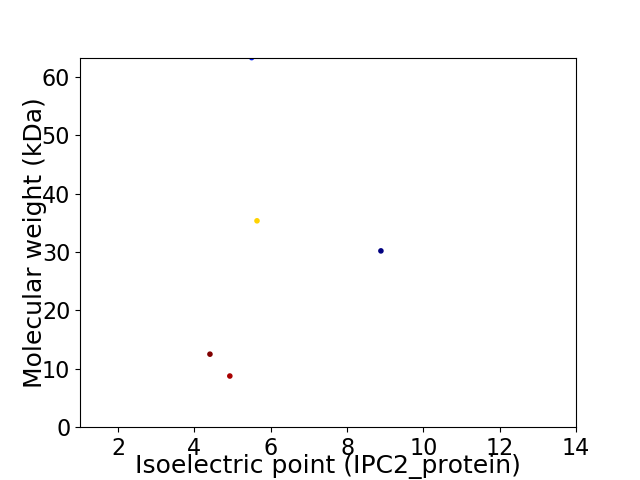
Virtual 2D-PAGE plot for 5 proteins (isoelectric point calculated using IPC2_protein)
Get csv file with sequences according to given criteria:
* You can choose from 21 different methods for calculating isoelectric point
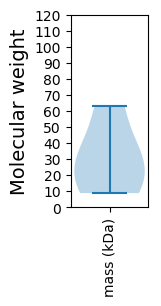
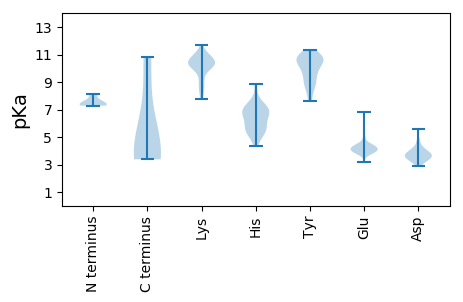
Summary statistics related to proteome-wise predictions


Protein with the lowest isoelectric point:
>tr|A0A4P8W8T0|A0A4P8W8T0_9VIRU Minor capsid protein OS=Capybara microvirus Cap3_SP_539 OX=2585471 PE=4 SV=1
MM1 pKa = 7.52EE2 pKa = 6.83RR3 pKa = 11.84ITKK6 pKa = 7.76QTFIPTMGEE15 pKa = 3.85YY16 pKa = 10.38NSPKK20 pKa = 9.7FGVFVEE26 pKa = 4.41TATYY30 pKa = 10.58VPAKK34 pKa = 10.81SMIEE38 pKa = 3.99SLMLAGEE45 pKa = 4.48RR46 pKa = 11.84LRR48 pKa = 11.84CARR51 pKa = 11.84AEE53 pKa = 4.13NYY55 pKa = 10.49DD56 pKa = 3.62SDD58 pKa = 4.15EE59 pKa = 4.24VEE61 pKa = 4.21PDD63 pKa = 3.23FGFDD67 pKa = 2.86TSVRR71 pKa = 11.84DD72 pKa = 3.95FEE74 pKa = 4.45LSEE77 pKa = 3.98IGSAISHH84 pKa = 6.54GALNPQPISQQTVVPEE100 pKa = 4.3SVPSEE105 pKa = 3.98ASAEE109 pKa = 4.0AQIQSS114 pKa = 3.4
MM1 pKa = 7.52EE2 pKa = 6.83RR3 pKa = 11.84ITKK6 pKa = 7.76QTFIPTMGEE15 pKa = 3.85YY16 pKa = 10.38NSPKK20 pKa = 9.7FGVFVEE26 pKa = 4.41TATYY30 pKa = 10.58VPAKK34 pKa = 10.81SMIEE38 pKa = 3.99SLMLAGEE45 pKa = 4.48RR46 pKa = 11.84LRR48 pKa = 11.84CARR51 pKa = 11.84AEE53 pKa = 4.13NYY55 pKa = 10.49DD56 pKa = 3.62SDD58 pKa = 4.15EE59 pKa = 4.24VEE61 pKa = 4.21PDD63 pKa = 3.23FGFDD67 pKa = 2.86TSVRR71 pKa = 11.84DD72 pKa = 3.95FEE74 pKa = 4.45LSEE77 pKa = 3.98IGSAISHH84 pKa = 6.54GALNPQPISQQTVVPEE100 pKa = 4.3SVPSEE105 pKa = 3.98ASAEE109 pKa = 4.0AQIQSS114 pKa = 3.4
Molecular weight: 12.51 kDa
Isoelectric point according different methods:
Protein with the highest isoelectric point:
>tr|A0A4P8W8S3|A0A4P8W8S3_9VIRU Uncharacterized protein OS=Capybara microvirus Cap3_SP_539 OX=2585471 PE=4 SV=1
MM1 pKa = 8.14DD2 pKa = 4.08CTFPLTIKK10 pKa = 10.61NPRR13 pKa = 11.84TNQFIKK19 pKa = 10.4VPCGMCIHH27 pKa = 6.43CRR29 pKa = 11.84IAKK32 pKa = 9.33VRR34 pKa = 11.84DD35 pKa = 2.95WSLRR39 pKa = 11.84LIHH42 pKa = 6.91EE43 pKa = 4.28NSLWQDD49 pKa = 2.94SCFITLTYY57 pKa = 10.87SDD59 pKa = 5.55DD60 pKa = 3.9NLPLTNCGKK69 pKa = 8.25MTLFKK74 pKa = 10.64PDD76 pKa = 3.4FQNFMKK82 pKa = 10.69RR83 pKa = 11.84LRR85 pKa = 11.84FRR87 pKa = 11.84VSSPIKK93 pKa = 10.0YY94 pKa = 8.43YY95 pKa = 11.13ACGEE99 pKa = 4.11YY100 pKa = 10.53GDD102 pKa = 4.17NGNRR106 pKa = 11.84PHH108 pKa = 5.65YY109 pKa = 9.78HH110 pKa = 6.74AIIFGMSCKK119 pKa = 10.25DD120 pKa = 3.26LRR122 pKa = 11.84DD123 pKa = 5.52FMICWDD129 pKa = 3.71KK130 pKa = 11.66GFVTVKK136 pKa = 9.9PVNAQRR142 pKa = 11.84CRR144 pKa = 11.84YY145 pKa = 7.85VCGYY149 pKa = 8.41IQKK152 pKa = 10.55KK153 pKa = 8.3IRR155 pKa = 11.84KK156 pKa = 8.29NPKK159 pKa = 8.72EE160 pKa = 3.89YY161 pKa = 10.4QSAYY165 pKa = 10.65GCLQPPFQLMSRR177 pKa = 11.84GLGLGYY183 pKa = 10.16LEE185 pKa = 4.92KK186 pKa = 10.88NRR188 pKa = 11.84EE189 pKa = 4.32EE190 pKa = 4.0YY191 pKa = 10.11WLTCRR196 pKa = 11.84NTLNGVPLSIPRR208 pKa = 11.84YY209 pKa = 7.6YY210 pKa = 10.78LKK212 pKa = 10.52KK213 pKa = 10.52DD214 pKa = 3.06WFLHH218 pKa = 5.11TKK220 pKa = 10.32VGLKK224 pKa = 10.05SDD226 pKa = 4.18SNPTTEE232 pKa = 4.01VEE234 pKa = 4.65SYY236 pKa = 11.33DD237 pKa = 4.51SAIQRR242 pKa = 11.84DD243 pKa = 3.81KK244 pKa = 11.45NVRR247 pKa = 11.84AKK249 pKa = 11.17NNLKK253 pKa = 10.08KK254 pKa = 10.58RR255 pKa = 11.84KK256 pKa = 9.13LL257 pKa = 3.52
MM1 pKa = 8.14DD2 pKa = 4.08CTFPLTIKK10 pKa = 10.61NPRR13 pKa = 11.84TNQFIKK19 pKa = 10.4VPCGMCIHH27 pKa = 6.43CRR29 pKa = 11.84IAKK32 pKa = 9.33VRR34 pKa = 11.84DD35 pKa = 2.95WSLRR39 pKa = 11.84LIHH42 pKa = 6.91EE43 pKa = 4.28NSLWQDD49 pKa = 2.94SCFITLTYY57 pKa = 10.87SDD59 pKa = 5.55DD60 pKa = 3.9NLPLTNCGKK69 pKa = 8.25MTLFKK74 pKa = 10.64PDD76 pKa = 3.4FQNFMKK82 pKa = 10.69RR83 pKa = 11.84LRR85 pKa = 11.84FRR87 pKa = 11.84VSSPIKK93 pKa = 10.0YY94 pKa = 8.43YY95 pKa = 11.13ACGEE99 pKa = 4.11YY100 pKa = 10.53GDD102 pKa = 4.17NGNRR106 pKa = 11.84PHH108 pKa = 5.65YY109 pKa = 9.78HH110 pKa = 6.74AIIFGMSCKK119 pKa = 10.25DD120 pKa = 3.26LRR122 pKa = 11.84DD123 pKa = 5.52FMICWDD129 pKa = 3.71KK130 pKa = 11.66GFVTVKK136 pKa = 9.9PVNAQRR142 pKa = 11.84CRR144 pKa = 11.84YY145 pKa = 7.85VCGYY149 pKa = 8.41IQKK152 pKa = 10.55KK153 pKa = 8.3IRR155 pKa = 11.84KK156 pKa = 8.29NPKK159 pKa = 8.72EE160 pKa = 3.89YY161 pKa = 10.4QSAYY165 pKa = 10.65GCLQPPFQLMSRR177 pKa = 11.84GLGLGYY183 pKa = 10.16LEE185 pKa = 4.92KK186 pKa = 10.88NRR188 pKa = 11.84EE189 pKa = 4.32EE190 pKa = 4.0YY191 pKa = 10.11WLTCRR196 pKa = 11.84NTLNGVPLSIPRR208 pKa = 11.84YY209 pKa = 7.6YY210 pKa = 10.78LKK212 pKa = 10.52KK213 pKa = 10.52DD214 pKa = 3.06WFLHH218 pKa = 5.11TKK220 pKa = 10.32VGLKK224 pKa = 10.05SDD226 pKa = 4.18SNPTTEE232 pKa = 4.01VEE234 pKa = 4.65SYY236 pKa = 11.33DD237 pKa = 4.51SAIQRR242 pKa = 11.84DD243 pKa = 3.81KK244 pKa = 11.45NVRR247 pKa = 11.84AKK249 pKa = 11.17NNLKK253 pKa = 10.08KK254 pKa = 10.58RR255 pKa = 11.84KK256 pKa = 9.13LL257 pKa = 3.52
Molecular weight: 30.19 kDa
Isoelectric point according different methods:
Peptides (in silico digests for buttom-up proteomics)
Below you can find in silico digests of the whole proteome with Trypsin, Chymotrypsin, Trypsin+LysC, LysN, ArgC proteases suitable for different mass spec machines.| Try ESI |
 |
|---|
| ChTry ESI |
 |
|---|
| ArgC ESI |
 |
|---|
| LysN ESI |
 |
|---|
| TryLysC ESI |
 |
|---|
| Try MALDI |
 |
|---|
| ChTry MALDI |
 |
|---|
| ArgC MALDI |
 |
|---|
| LysN MALDI |
 |
|---|
| TryLysC MALDI |
 |
|---|
| Try LTQ |
 |
|---|
| ChTry LTQ |
 |
|---|
| ArgC LTQ |
 |
|---|
| LysN LTQ |
 |
|---|
| TryLysC LTQ |
 |
|---|
| Try MSlow |
 |
|---|
| ChTry MSlow |
 |
|---|
| ArgC MSlow |
 |
|---|
| LysN MSlow |
 |
|---|
| TryLysC MSlow |
 |
|---|
| Try MShigh |
 |
|---|
| ChTry MShigh |
 |
|---|
| ArgC MShigh |
 |
|---|
| LysN MShigh |
 |
|---|
| TryLysC MShigh |
 |
|---|
General Statistics
Number of major isoforms |
Number of additional isoforms |
Number of all proteins |
Number of amino acids |
Min. Seq. Length |
Max. Seq. Length |
Avg. Seq. Length |
Avg. Mol. Weight |
|---|---|---|---|---|---|---|---|
0 |
1329 |
74 |
565 |
265.8 |
30.02 |
Amino acid frequency
Ala |
Cys |
Asp |
Glu |
Phe |
Gly |
His |
Ile |
Lys |
Leu |
|---|---|---|---|---|---|---|---|---|---|
6.396 ± 0.997 | 1.731 ± 0.87 |
5.117 ± 0.108 | 5.643 ± 1.034 |
5.041 ± 0.446 | 6.321 ± 0.784 |
1.731 ± 0.329 | 5.418 ± 0.42 |
5.719 ± 1.126 | 7.901 ± 0.716 |
Met |
Asn |
Gln |
Pro |
Arg |
Ser |
Thr |
Val |
Trp |
Tyr |
|---|---|---|---|---|---|---|---|---|---|
2.182 ± 0.398 | 6.998 ± 0.678 |
4.439 ± 1.137 | 4.515 ± 0.655 |
4.59 ± 0.844 | 8.427 ± 0.997 |
5.493 ± 0.74 | 6.095 ± 0.823 |
1.43 ± 0.316 | 4.816 ± 0.378 |
Most of the basic statistics you can see at this page can be downloaded from this CSV file
Proteome-pI is available under Creative Commons Attribution-NoDerivs license, for more details see here
| Reference: Kozlowski LP. Proteome-pI 2.0: Proteome Isoelectric Point Database Update. Nucleic Acids Res. 2021, doi: 10.1093/nar/gkab944 | Contact: Lukasz P. Kozlowski |
