Sorangiineae bacterium NIC37A_2
Taxonomy: cellular organisms; Bacteria; Proteobacteria; delta/epsilon subdivisions; Deltaproteobacteria; Myxococcales; Sorangiineae; unclassified Sorangiineae
Average proteome isoelectric point is 6.39
Get precalculated fractions of proteins

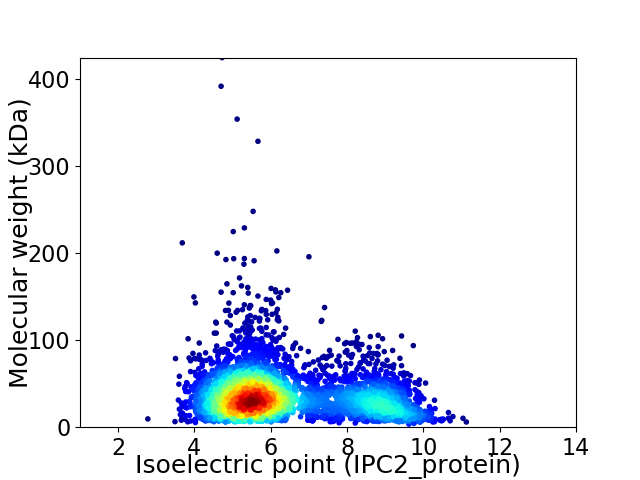
Virtual 2D-PAGE plot for 4071 proteins (isoelectric point calculated using IPC2_protein)
Get csv file with sequences according to given criteria:
* You can choose from 21 different methods for calculating isoelectric point
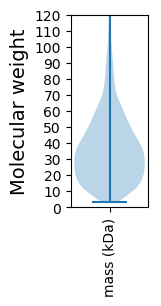
Summary statistics related to proteome-wise predictions


Protein with the lowest isoelectric point:
>tr|A0A1W9QGE6|A0A1W9QGE6_9DELT Fer2_BFD domain-containing protein OS=Sorangiineae bacterium NIC37A_2 OX=1970199 GN=B6A08_03530 PE=4 SV=1
MM1 pKa = 7.49GGALSFGGGDD11 pKa = 3.48EE12 pKa = 4.38VVLIDD17 pKa = 6.31DD18 pKa = 5.1FDD20 pKa = 7.2DD21 pKa = 5.2DD22 pKa = 4.83DD23 pKa = 6.69ALFEE27 pKa = 5.1SNGLNGGWYY36 pKa = 10.05AYY38 pKa = 10.67GDD40 pKa = 3.99GSNGTLTHH48 pKa = 6.38SEE50 pKa = 4.02GLVPVSGGVRR60 pKa = 11.84GGALRR65 pKa = 11.84VQSEE69 pKa = 4.73GFTAWGSVFGAYY81 pKa = 10.11LSEE84 pKa = 4.25GCLYY88 pKa = 10.85DD89 pKa = 4.78GSAFDD94 pKa = 5.3GLTFYY99 pKa = 11.43AKK101 pKa = 10.29GQVEE105 pKa = 4.46GGPNQEE111 pKa = 3.71LSVRR115 pKa = 11.84LVSLEE120 pKa = 4.27DD121 pKa = 3.56MPPEE125 pKa = 4.12QGGTCDD131 pKa = 3.49SDD133 pKa = 3.27CWNSHH138 pKa = 4.85RR139 pKa = 11.84VNIEE143 pKa = 3.41VGGCWRR149 pKa = 11.84RR150 pKa = 11.84YY151 pKa = 7.33SFRR154 pKa = 11.84FDD156 pKa = 2.85EE157 pKa = 4.77FLRR160 pKa = 11.84AGQSTSSVVPSEE172 pKa = 3.77LHH174 pKa = 6.89LIDD177 pKa = 4.51FALSTVDD184 pKa = 5.49SADD187 pKa = 2.95VWLDD191 pKa = 3.31EE192 pKa = 4.21LAFFIGDD199 pKa = 3.42APGEE203 pKa = 4.09EE204 pKa = 4.83EE205 pKa = 4.51ICDD208 pKa = 3.53
MM1 pKa = 7.49GGALSFGGGDD11 pKa = 3.48EE12 pKa = 4.38VVLIDD17 pKa = 6.31DD18 pKa = 5.1FDD20 pKa = 7.2DD21 pKa = 5.2DD22 pKa = 4.83DD23 pKa = 6.69ALFEE27 pKa = 5.1SNGLNGGWYY36 pKa = 10.05AYY38 pKa = 10.67GDD40 pKa = 3.99GSNGTLTHH48 pKa = 6.38SEE50 pKa = 4.02GLVPVSGGVRR60 pKa = 11.84GGALRR65 pKa = 11.84VQSEE69 pKa = 4.73GFTAWGSVFGAYY81 pKa = 10.11LSEE84 pKa = 4.25GCLYY88 pKa = 10.85DD89 pKa = 4.78GSAFDD94 pKa = 5.3GLTFYY99 pKa = 11.43AKK101 pKa = 10.29GQVEE105 pKa = 4.46GGPNQEE111 pKa = 3.71LSVRR115 pKa = 11.84LVSLEE120 pKa = 4.27DD121 pKa = 3.56MPPEE125 pKa = 4.12QGGTCDD131 pKa = 3.49SDD133 pKa = 3.27CWNSHH138 pKa = 4.85RR139 pKa = 11.84VNIEE143 pKa = 3.41VGGCWRR149 pKa = 11.84RR150 pKa = 11.84YY151 pKa = 7.33SFRR154 pKa = 11.84FDD156 pKa = 2.85EE157 pKa = 4.77FLRR160 pKa = 11.84AGQSTSSVVPSEE172 pKa = 3.77LHH174 pKa = 6.89LIDD177 pKa = 4.51FALSTVDD184 pKa = 5.49SADD187 pKa = 2.95VWLDD191 pKa = 3.31EE192 pKa = 4.21LAFFIGDD199 pKa = 3.42APGEE203 pKa = 4.09EE204 pKa = 4.83EE205 pKa = 4.51ICDD208 pKa = 3.53
Molecular weight: 22.19 kDa
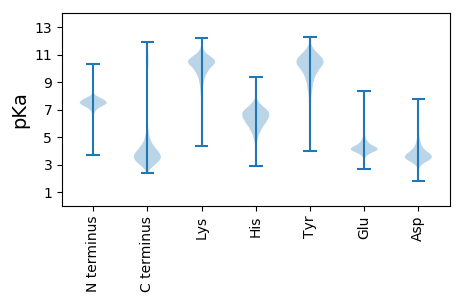
Isoelectric point according different methods:
Protein with the highest isoelectric point:
>tr|A0A1W9QCZ8|A0A1W9QCZ8_9DELT Uncharacterized protein OS=Sorangiineae bacterium NIC37A_2 OX=1970199 GN=B6A08_10125 PE=4 SV=1
MM1 pKa = 7.62AIWARR6 pKa = 11.84MARR9 pKa = 11.84AWAVRR14 pKa = 11.84PWTLRR19 pKa = 11.84AGMSVRR25 pKa = 11.84VGVRR29 pKa = 11.84SVLAALFQAPVVPRR43 pKa = 11.84QGEE46 pKa = 4.3GMPLAGARR54 pKa = 11.84LGAPRR59 pKa = 11.84QAAPQAVATLLVVLRR74 pKa = 11.84AQGARR79 pKa = 11.84IRR81 pKa = 11.84GARR84 pKa = 11.84AQARR88 pKa = 11.84VARR91 pKa = 11.84TPVGPGGG98 pKa = 3.43
MM1 pKa = 7.62AIWARR6 pKa = 11.84MARR9 pKa = 11.84AWAVRR14 pKa = 11.84PWTLRR19 pKa = 11.84AGMSVRR25 pKa = 11.84VGVRR29 pKa = 11.84SVLAALFQAPVVPRR43 pKa = 11.84QGEE46 pKa = 4.3GMPLAGARR54 pKa = 11.84LGAPRR59 pKa = 11.84QAAPQAVATLLVVLRR74 pKa = 11.84AQGARR79 pKa = 11.84IRR81 pKa = 11.84GARR84 pKa = 11.84AQARR88 pKa = 11.84VARR91 pKa = 11.84TPVGPGGG98 pKa = 3.43
Molecular weight: 10.26 kDa
Isoelectric point according different methods:
Peptides (in silico digests for buttom-up proteomics)
Below you can find in silico digests of the whole proteome with Trypsin, Chymotrypsin, Trypsin+LysC, LysN, ArgC proteases suitable for different mass spec machines.| Try ESI |
 |
|---|
| ChTry ESI |
 |
|---|
| ArgC ESI |
 |
|---|
| LysN ESI |
 |
|---|
| TryLysC ESI |
 |
|---|
| Try MALDI |
 |
|---|
| ChTry MALDI |
 |
|---|
| ArgC MALDI |
 |
|---|
| LysN MALDI |
 |
|---|
| TryLysC MALDI |
 |
|---|
| Try LTQ |
 |
|---|
| ChTry LTQ |
 |
|---|
| ArgC LTQ |
 |
|---|
| LysN LTQ |
 |
|---|
| TryLysC LTQ |
 |
|---|
| Try MSlow |
 |
|---|
| ChTry MSlow |
 |
|---|
| ArgC MSlow |
 |
|---|
| LysN MSlow |
 |
|---|
| TryLysC MSlow |
 |
|---|
| Try MShigh |
 |
|---|
| ChTry MShigh |
 |
|---|
| ArgC MShigh |
 |
|---|
| LysN MShigh |
 |
|---|
| TryLysC MShigh |
 |
|---|
General Statistics
Number of major isoforms |
Number of additional isoforms |
Number of all proteins |
Number of amino acids |
Min. Seq. Length |
Max. Seq. Length |
Avg. Seq. Length |
Avg. Mol. Weight |
|---|---|---|---|---|---|---|---|
0 |
1466748 |
33 |
3805 |
360.3 |
39.1 |
Amino acid frequency
Ala |
Cys |
Asp |
Glu |
Phe |
Gly |
His |
Ile |
Lys |
Leu |
|---|---|---|---|---|---|---|---|---|---|
11.182 ± 0.043 | 1.059 ± 0.024 |
5.268 ± 0.032 | 7.175 ± 0.047 |
3.62 ± 0.024 | 8.834 ± 0.061 |
1.896 ± 0.015 | 4.043 ± 0.029 |
3.359 ± 0.032 | 10.786 ± 0.058 |
Met |
Asn |
Gln |
Pro |
Arg |
Ser |
Thr |
Val |
Trp |
Tyr |
|---|---|---|---|---|---|---|---|---|---|
1.693 ± 0.016 | 2.172 ± 0.023 |
5.928 ± 0.037 | 2.936 ± 0.018 |
7.699 ± 0.047 | 6.714 ± 0.034 |
5.061 ± 0.024 | 7.285 ± 0.034 |
1.146 ± 0.014 | 2.139 ± 0.021 |
Most of the basic statistics you can see at this page can be downloaded from this CSV file
Proteome-pI is available under Creative Commons Attribution-NoDerivs license, for more details see here
| Reference: Kozlowski LP. Proteome-pI 2.0: Proteome Isoelectric Point Database Update. Nucleic Acids Res. 2021, doi: 10.1093/nar/gkab944 | Contact: Lukasz P. Kozlowski |
