Sphingobacterium sp. dk4302
Taxonomy: cellular organisms; Bacteria; FCB group; Bacteroidetes/Chlorobi group; Bacteroidetes; Sphingobacteriia; Sphingobacteriales; Sphingobacteriaceae; Sphingobacterium; unclassified Sphingobacterium
Average proteome isoelectric point is 6.51
Get precalculated fractions of proteins

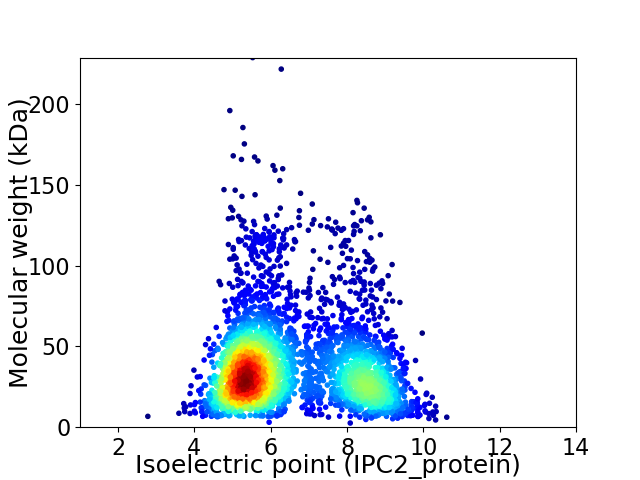
Virtual 2D-PAGE plot for 3478 proteins (isoelectric point calculated using IPC2_protein)
Get csv file with sequences according to given criteria:
* You can choose from 21 different methods for calculating isoelectric point
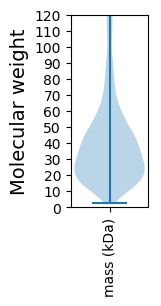
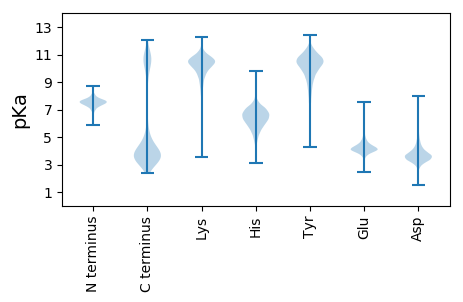
Summary statistics related to proteome-wise predictions


Protein with the lowest isoelectric point:
>tr|A0A5Q0QGT1|A0A5Q0QGT1_9SPHI Carboxypeptidase-like regulatory domain-containing protein OS=Sphingobacterium sp. dk4302 OX=2662364 GN=GFH32_11435 PE=4 SV=1
MM1 pKa = 7.42KK2 pKa = 10.17HH3 pKa = 6.01QINTSEE9 pKa = 3.67ARR11 pKa = 11.84VYY13 pKa = 10.51VGTYY17 pKa = 9.68GKK19 pKa = 10.68YY20 pKa = 9.48NDD22 pKa = 3.91GSIFGKK28 pKa = 9.65WLDD31 pKa = 3.67LSDD34 pKa = 3.9YY35 pKa = 11.13ANSDD39 pKa = 3.43EE40 pKa = 6.01FYY42 pKa = 9.16TACKK46 pKa = 9.7EE47 pKa = 4.07LHH49 pKa = 6.45NDD51 pKa = 3.23EE52 pKa = 5.29ADD54 pKa = 3.6PEE56 pKa = 4.99FMFQDD61 pKa = 4.05YY62 pKa = 11.31EE63 pKa = 4.3NIPNGLIGEE72 pKa = 4.36SWISNNIFEE81 pKa = 4.62VLEE84 pKa = 4.02ALKK87 pKa = 11.23DD88 pKa = 3.45MDD90 pKa = 4.17EE91 pKa = 4.22SRR93 pKa = 11.84KK94 pKa = 9.42EE95 pKa = 4.55AFLIWCDD102 pKa = 3.13NGHH105 pKa = 6.56RR106 pKa = 11.84KK107 pKa = 9.7LSEE110 pKa = 3.86TDD112 pKa = 3.03ISDD115 pKa = 4.12LMSDD119 pKa = 4.7FDD121 pKa = 5.05DD122 pKa = 6.17DD123 pKa = 5.36YY124 pKa = 11.42IGEE127 pKa = 4.34YY128 pKa = 10.1KK129 pKa = 10.71DD130 pKa = 4.44EE131 pKa = 4.16EE132 pKa = 4.36DD133 pKa = 3.41FAYY136 pKa = 10.22EE137 pKa = 4.02QVEE140 pKa = 4.31QMDD143 pKa = 4.07LPEE146 pKa = 4.13FAKK149 pKa = 10.63QYY151 pKa = 10.87FDD153 pKa = 3.66YY154 pKa = 10.72EE155 pKa = 4.17AYY157 pKa = 10.44ARR159 pKa = 11.84DD160 pKa = 4.51LFSGDD165 pKa = 3.18YY166 pKa = 9.57WSDD169 pKa = 2.95SGYY172 pKa = 11.05VFYY175 pKa = 11.36NSS177 pKa = 3.31
MM1 pKa = 7.42KK2 pKa = 10.17HH3 pKa = 6.01QINTSEE9 pKa = 3.67ARR11 pKa = 11.84VYY13 pKa = 10.51VGTYY17 pKa = 9.68GKK19 pKa = 10.68YY20 pKa = 9.48NDD22 pKa = 3.91GSIFGKK28 pKa = 9.65WLDD31 pKa = 3.67LSDD34 pKa = 3.9YY35 pKa = 11.13ANSDD39 pKa = 3.43EE40 pKa = 6.01FYY42 pKa = 9.16TACKK46 pKa = 9.7EE47 pKa = 4.07LHH49 pKa = 6.45NDD51 pKa = 3.23EE52 pKa = 5.29ADD54 pKa = 3.6PEE56 pKa = 4.99FMFQDD61 pKa = 4.05YY62 pKa = 11.31EE63 pKa = 4.3NIPNGLIGEE72 pKa = 4.36SWISNNIFEE81 pKa = 4.62VLEE84 pKa = 4.02ALKK87 pKa = 11.23DD88 pKa = 3.45MDD90 pKa = 4.17EE91 pKa = 4.22SRR93 pKa = 11.84KK94 pKa = 9.42EE95 pKa = 4.55AFLIWCDD102 pKa = 3.13NGHH105 pKa = 6.56RR106 pKa = 11.84KK107 pKa = 9.7LSEE110 pKa = 3.86TDD112 pKa = 3.03ISDD115 pKa = 4.12LMSDD119 pKa = 4.7FDD121 pKa = 5.05DD122 pKa = 6.17DD123 pKa = 5.36YY124 pKa = 11.42IGEE127 pKa = 4.34YY128 pKa = 10.1KK129 pKa = 10.71DD130 pKa = 4.44EE131 pKa = 4.16EE132 pKa = 4.36DD133 pKa = 3.41FAYY136 pKa = 10.22EE137 pKa = 4.02QVEE140 pKa = 4.31QMDD143 pKa = 4.07LPEE146 pKa = 4.13FAKK149 pKa = 10.63QYY151 pKa = 10.87FDD153 pKa = 3.66YY154 pKa = 10.72EE155 pKa = 4.17AYY157 pKa = 10.44ARR159 pKa = 11.84DD160 pKa = 4.51LFSGDD165 pKa = 3.18YY166 pKa = 9.57WSDD169 pKa = 2.95SGYY172 pKa = 11.05VFYY175 pKa = 11.36NSS177 pKa = 3.31
Molecular weight: 20.87 kDa
Isoelectric point according different methods:
Protein with the highest isoelectric point:
>tr|A0A5Q0QIB4|A0A5Q0QIB4_9SPHI Acyltransferase family protein OS=Sphingobacterium sp. dk4302 OX=2662364 GN=GFH32_17145 PE=4 SV=1
MM1 pKa = 6.97QAGSKK6 pKa = 9.88FIQLMSRR13 pKa = 11.84LSRR16 pKa = 11.84RR17 pKa = 11.84IRR19 pKa = 11.84WNFKK23 pKa = 8.45QEE25 pKa = 3.73NRR27 pKa = 11.84FGSAGVARR35 pKa = 11.84AAFALLLLGLFLYY48 pKa = 10.65VVLDD52 pKa = 3.37SRR54 pKa = 11.84LYY56 pKa = 7.72PWEE59 pKa = 3.96YY60 pKa = 11.31ASLQRR65 pKa = 11.84ATGVALQQSAEE76 pKa = 3.92HH77 pKa = 6.76RR78 pKa = 11.84FQLRR82 pKa = 11.84AEE84 pKa = 4.05APEE87 pKa = 3.86NFRR90 pKa = 11.84IRR92 pKa = 11.84AFCRR96 pKa = 11.84YY97 pKa = 8.4MDD99 pKa = 4.56SLNSSPQGKK108 pKa = 7.91KK109 pKa = 8.73TYY111 pKa = 10.46DD112 pKa = 3.35SIMEE116 pKa = 4.15RR117 pKa = 11.84RR118 pKa = 11.84PGLLDD123 pKa = 3.18SARR126 pKa = 11.84NLLYY130 pKa = 10.44HH131 pKa = 6.05YY132 pKa = 10.63NN133 pKa = 3.58
MM1 pKa = 6.97QAGSKK6 pKa = 9.88FIQLMSRR13 pKa = 11.84LSRR16 pKa = 11.84RR17 pKa = 11.84IRR19 pKa = 11.84WNFKK23 pKa = 8.45QEE25 pKa = 3.73NRR27 pKa = 11.84FGSAGVARR35 pKa = 11.84AAFALLLLGLFLYY48 pKa = 10.65VVLDD52 pKa = 3.37SRR54 pKa = 11.84LYY56 pKa = 7.72PWEE59 pKa = 3.96YY60 pKa = 11.31ASLQRR65 pKa = 11.84ATGVALQQSAEE76 pKa = 3.92HH77 pKa = 6.76RR78 pKa = 11.84FQLRR82 pKa = 11.84AEE84 pKa = 4.05APEE87 pKa = 3.86NFRR90 pKa = 11.84IRR92 pKa = 11.84AFCRR96 pKa = 11.84YY97 pKa = 8.4MDD99 pKa = 4.56SLNSSPQGKK108 pKa = 7.91KK109 pKa = 8.73TYY111 pKa = 10.46DD112 pKa = 3.35SIMEE116 pKa = 4.15RR117 pKa = 11.84RR118 pKa = 11.84PGLLDD123 pKa = 3.18SARR126 pKa = 11.84NLLYY130 pKa = 10.44HH131 pKa = 6.05YY132 pKa = 10.63NN133 pKa = 3.58
Molecular weight: 15.48 kDa
Isoelectric point according different methods:
Peptides (in silico digests for buttom-up proteomics)
Below you can find in silico digests of the whole proteome with Trypsin, Chymotrypsin, Trypsin+LysC, LysN, ArgC proteases suitable for different mass spec machines.| Try ESI |
 |
|---|
| ChTry ESI |
 |
|---|
| ArgC ESI |
 |
|---|
| LysN ESI |
 |
|---|
| TryLysC ESI |
 |
|---|
| Try MALDI |
 |
|---|
| ChTry MALDI |
 |
|---|
| ArgC MALDI |
 |
|---|
| LysN MALDI |
 |
|---|
| TryLysC MALDI |
 |
|---|
| Try LTQ |
 |
|---|
| ChTry LTQ |
 |
|---|
| ArgC LTQ |
 |
|---|
| LysN LTQ |
 |
|---|
| TryLysC LTQ |
 |
|---|
| Try MSlow |
 |
|---|
| ChTry MSlow |
 |
|---|
| ArgC MSlow |
 |
|---|
| LysN MSlow |
 |
|---|
| TryLysC MSlow |
 |
|---|
| Try MShigh |
 |
|---|
| ChTry MShigh |
 |
|---|
| ArgC MShigh |
 |
|---|
| LysN MShigh |
 |
|---|
| TryLysC MShigh |
 |
|---|
General Statistics
Number of major isoforms |
Number of additional isoforms |
Number of all proteins |
Number of amino acids |
Min. Seq. Length |
Max. Seq. Length |
Avg. Seq. Length |
Avg. Mol. Weight |
|---|---|---|---|---|---|---|---|
0 |
1255142 |
25 |
2009 |
360.9 |
40.62 |
Amino acid frequency
Ala |
Cys |
Asp |
Glu |
Phe |
Gly |
His |
Ile |
Lys |
Leu |
|---|---|---|---|---|---|---|---|---|---|
7.253 ± 0.038 | 0.706 ± 0.011 |
5.499 ± 0.025 | 6.184 ± 0.037 |
4.935 ± 0.031 | 6.626 ± 0.038 |
1.845 ± 0.02 | 7.383 ± 0.036 |
6.973 ± 0.033 | 9.589 ± 0.047 |
Met |
Asn |
Gln |
Pro |
Arg |
Ser |
Thr |
Val |
Trp |
Tyr |
|---|---|---|---|---|---|---|---|---|---|
2.287 ± 0.017 | 5.692 ± 0.036 |
3.543 ± 0.02 | 3.933 ± 0.021 |
4.074 ± 0.025 | 6.687 ± 0.034 |
5.219 ± 0.027 | 6.227 ± 0.032 |
1.182 ± 0.014 | 4.162 ± 0.029 |
Most of the basic statistics you can see at this page can be downloaded from this CSV file
Proteome-pI is available under Creative Commons Attribution-NoDerivs license, for more details see here
| Reference: Kozlowski LP. Proteome-pI 2.0: Proteome Isoelectric Point Database Update. Nucleic Acids Res. 2021, doi: 10.1093/nar/gkab944 | Contact: Lukasz P. Kozlowski |
